Security update: RingQ is patched against the critical PHP vulnerabilities. Update your servers today.
Read nowRingQ queue statistics reports show how your call center queues perform: how many calls were answered, how long callers waited, your service level (SLA), which callers hung up and whether they were called back.
In the RingQ web app, click Reports, then Queue Statistics, then the report you want. Pick a date range and filters, and the report shows straight away.
| Report | What it shows | Filters |
|---|---|---|
| Queue Performance Overview | Every queue call with its agent, waiting time, result and wrap-up. | Date range, Queue |
| Detailed Queue Statistics | Answered, abandoned, % serviced, talk time and callbacks per queue. | Date range, Queue |
| Abandoned Queue Calls | Callers who hung up before an agent answered, with how long each one waited. | Date range, Queue, Ignore short calls |
| Answered Calls by Waiting Time | Answered calls grouped by how long the caller waited: 0-15 seconds, 15-30 seconds, 30-60 seconds and over 60 seconds. | Date range, Queue |
| SLA Statistics | The share of calls answered within your target time, per queue and per hour. | Date range, Queue, SLA target, Ignore short calls |
| SLA Breaches | Every call that waited longer than the queue's target time. | Date range, Queue, SLA target, Ignore short calls |
| Queue Callbacks | Missed and abandoned callers, and whether each one was called back. | Date range, Queue |
| Team Queue Statistics | A team view of each queue: the agents on it, calls per agent and busy time. | Date range, Queue |
Every queue call with its agent, waiting time, result and wrap-up. Switch between Calls and Summary to see the totals for each queue and its agents. Choose 10, 25, 50 or 100 rows per page.
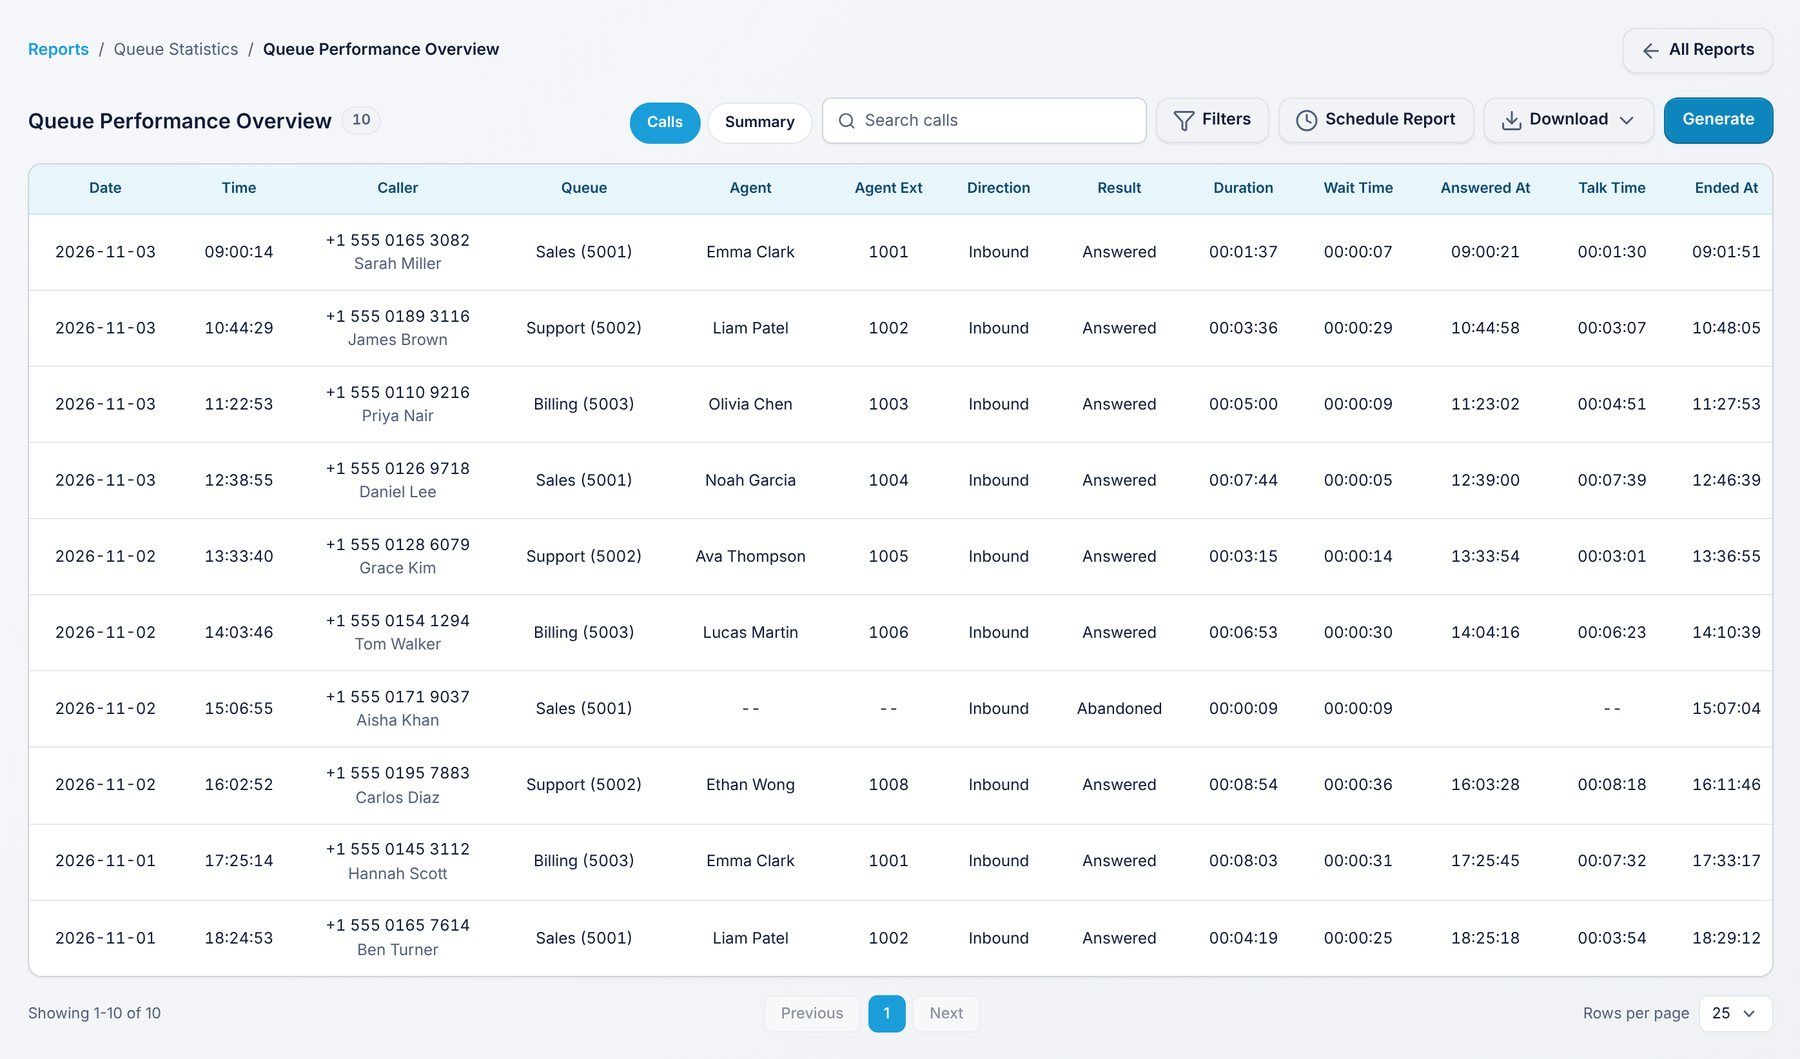
Use it to: check any single queue call, and see the totals for each queue.
Filters: Date range, Queue.
Answered, abandoned, % serviced, talk time and callbacks per queue.
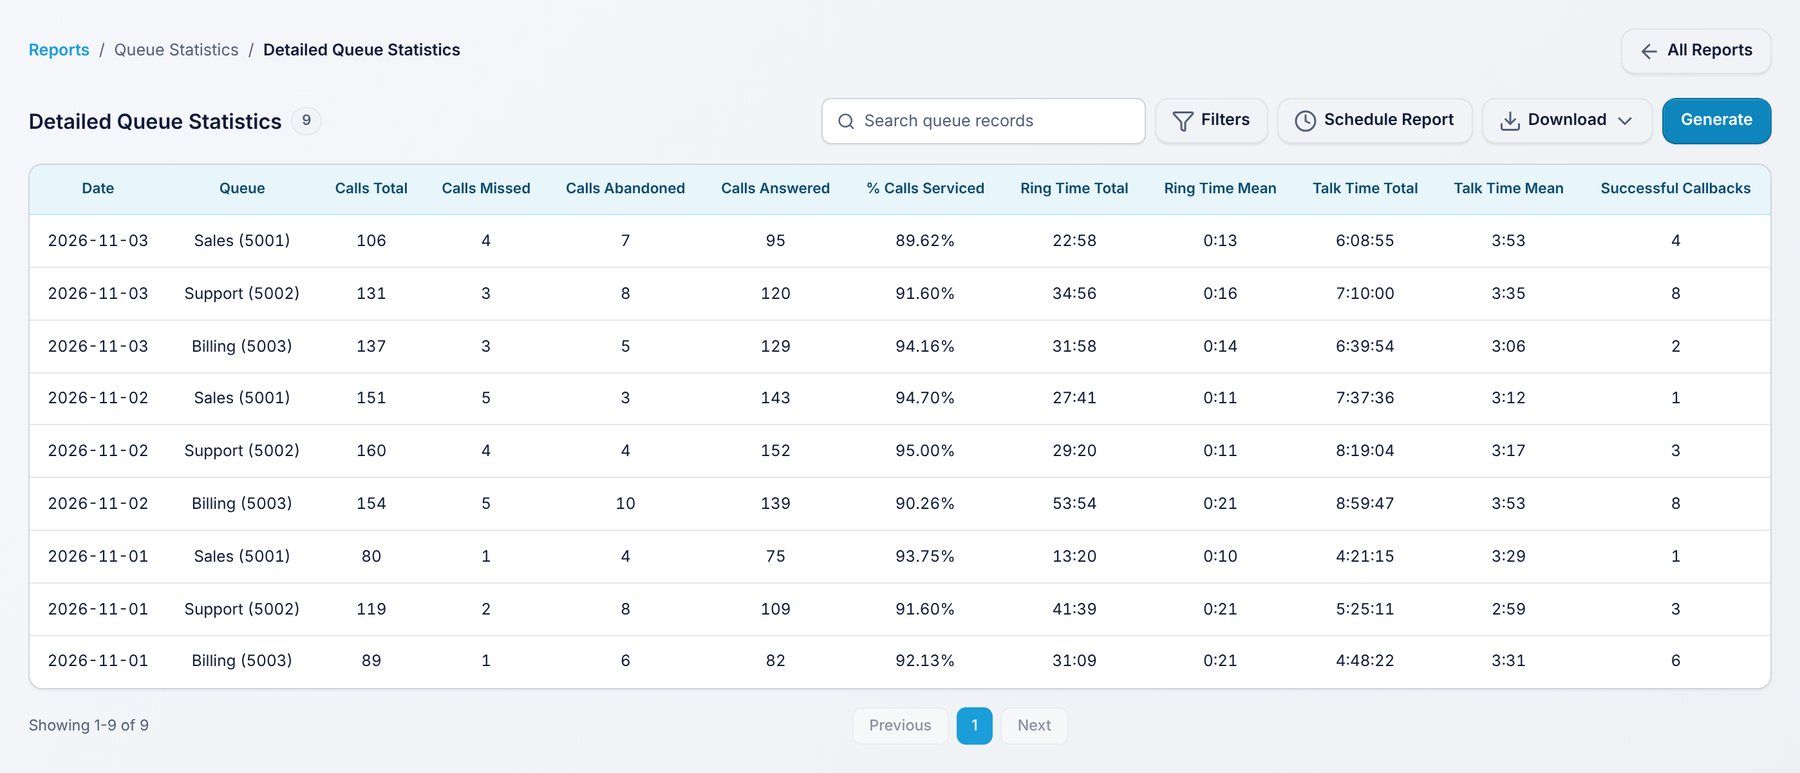
Use it to: compare your queues side by side.
Filters: Date range, Queue.
Callers who hung up before an agent answered, with how long each one waited.
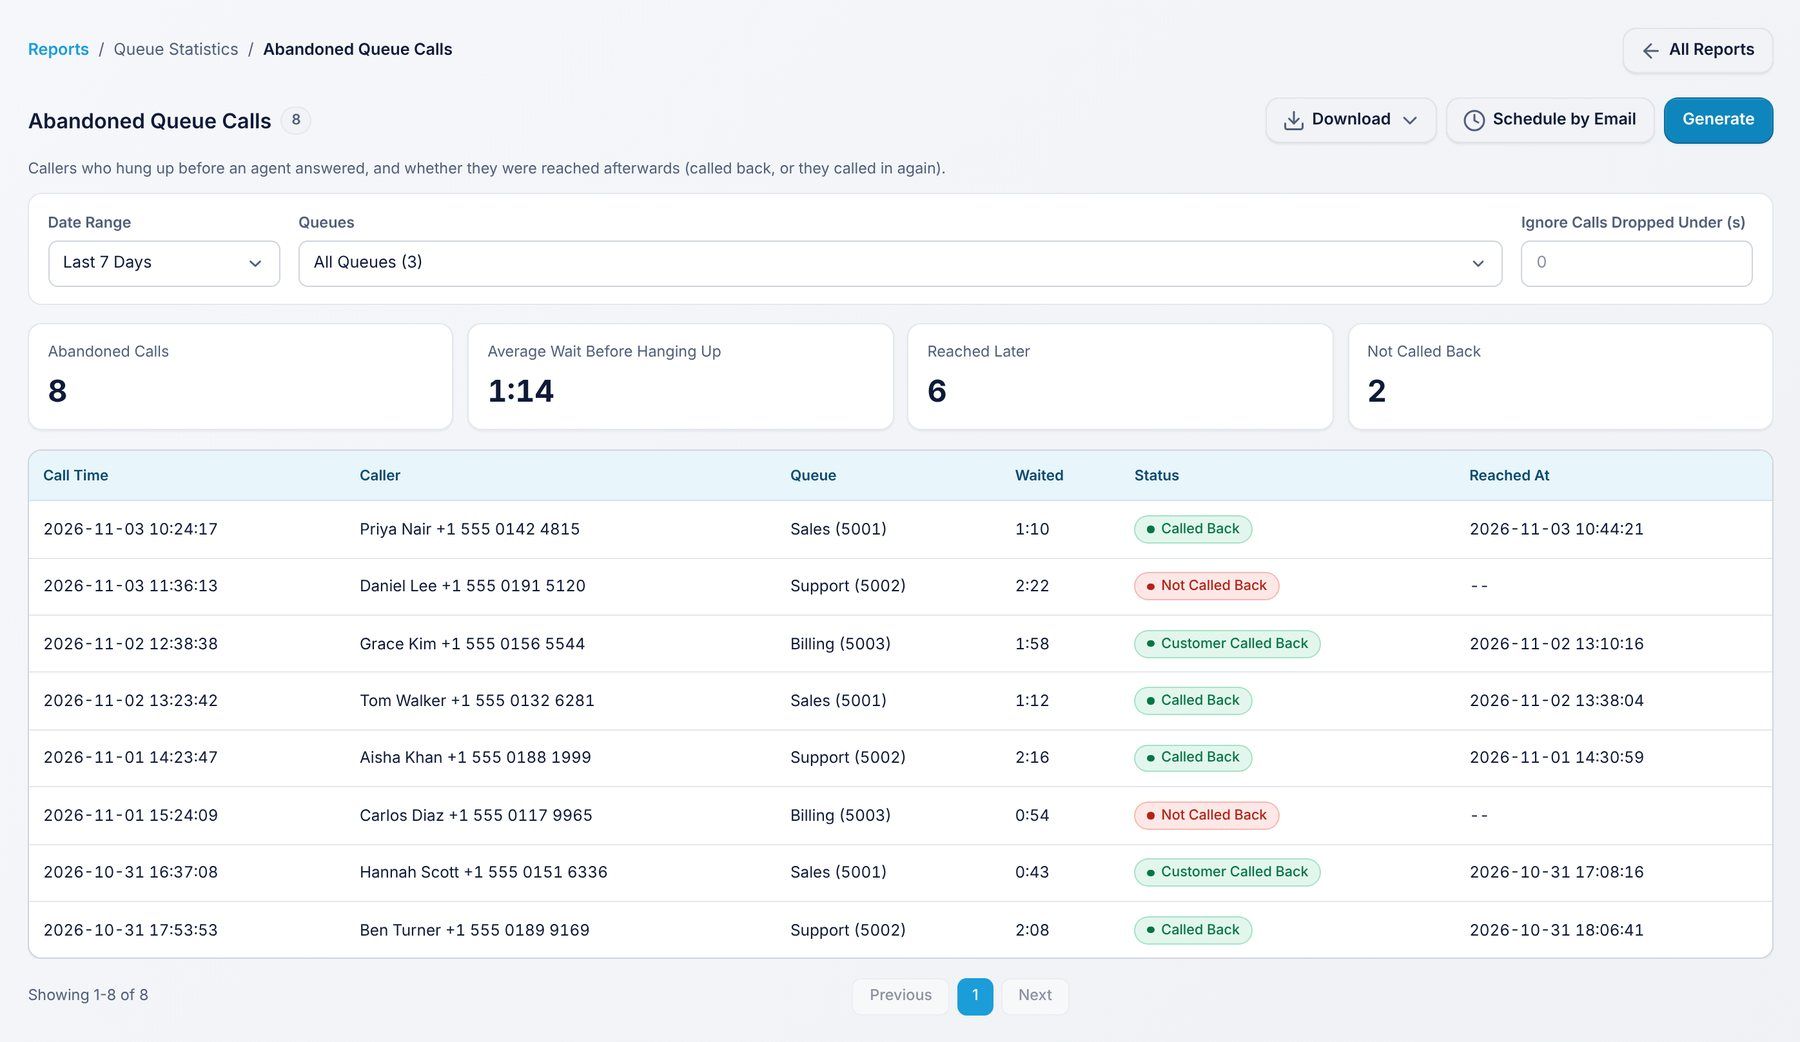
Use it to: find callers to call back, and see how long people wait before they give up. Turn on Ignore short calls to leave out callers who hung up within a few seconds.
Filters: Date range, Queue, Ignore short calls.
Answered calls grouped by how long the caller waited: 0-15 seconds, 15-30 seconds, 30-60 seconds and over 60 seconds.
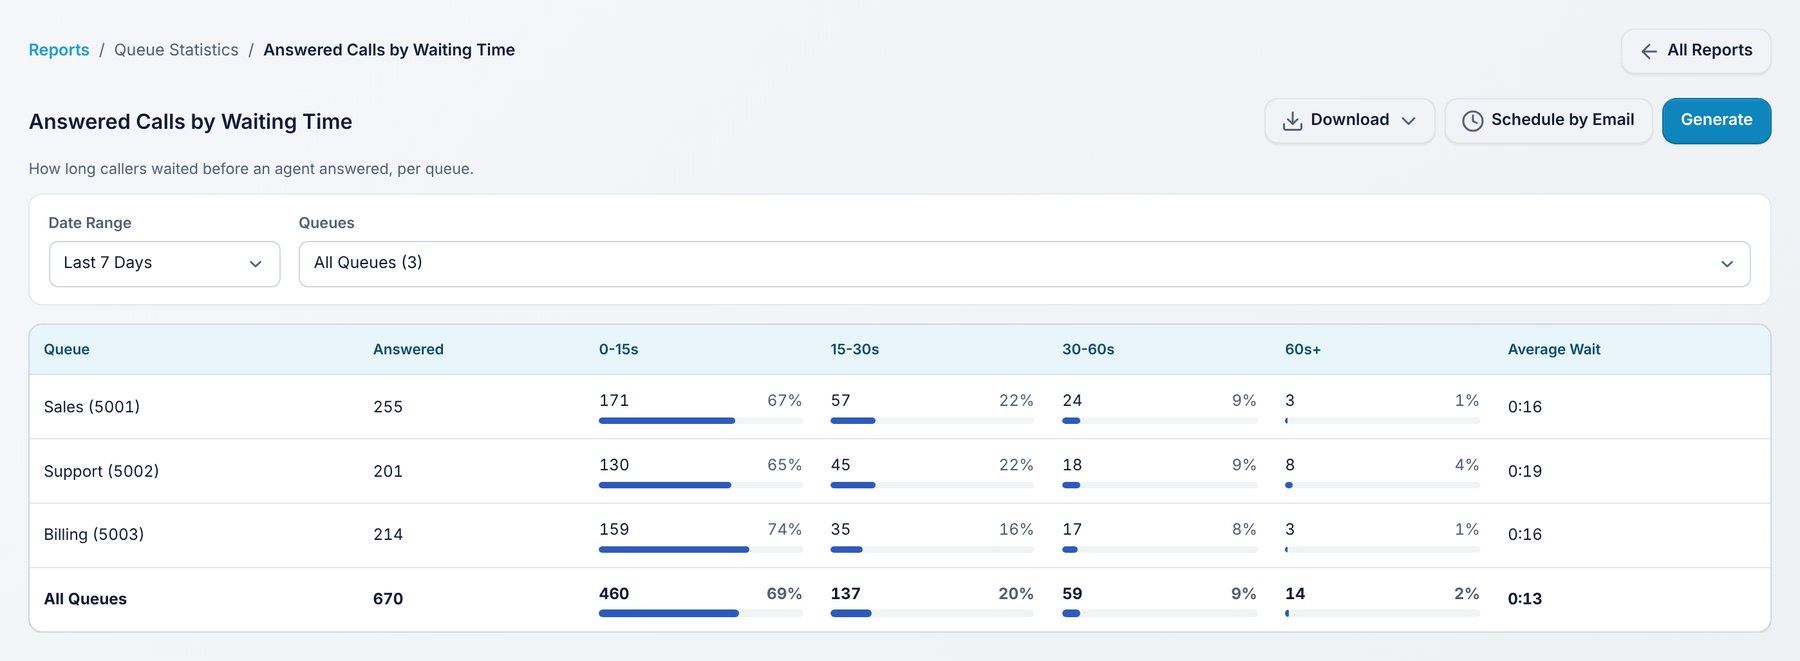
Use it to: see how quickly most callers are answered.
Filters: Date range, Queue.
The share of calls answered within your target time, per queue and per hour. The target comes from the queue's SLA time, and you can change it in the report.
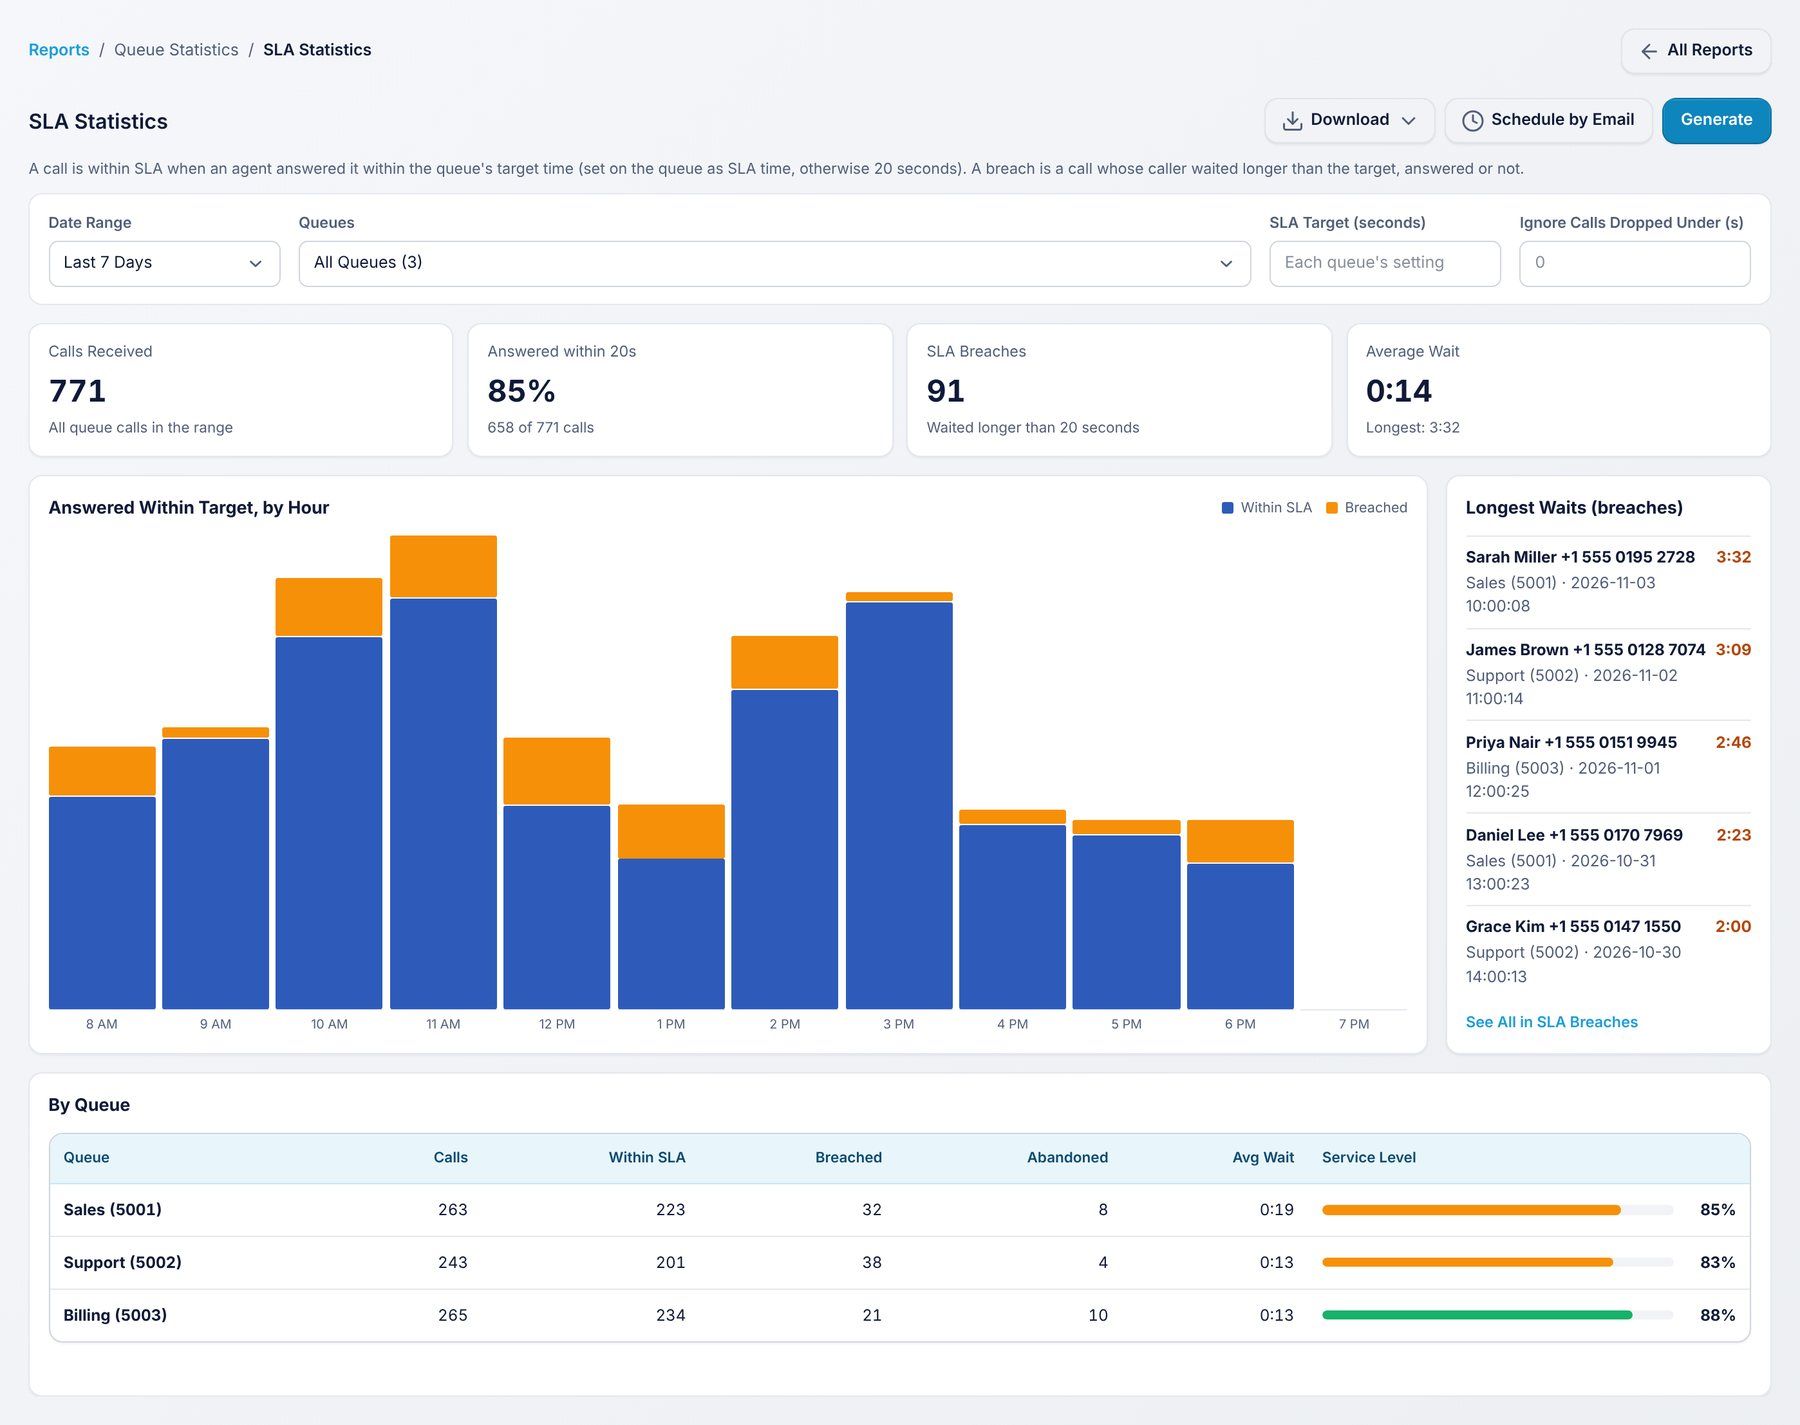
Use it to: track your service level against your target.
Filters: Date range, Queue, SLA target, Ignore short calls.
Every call that waited longer than the queue's target time.
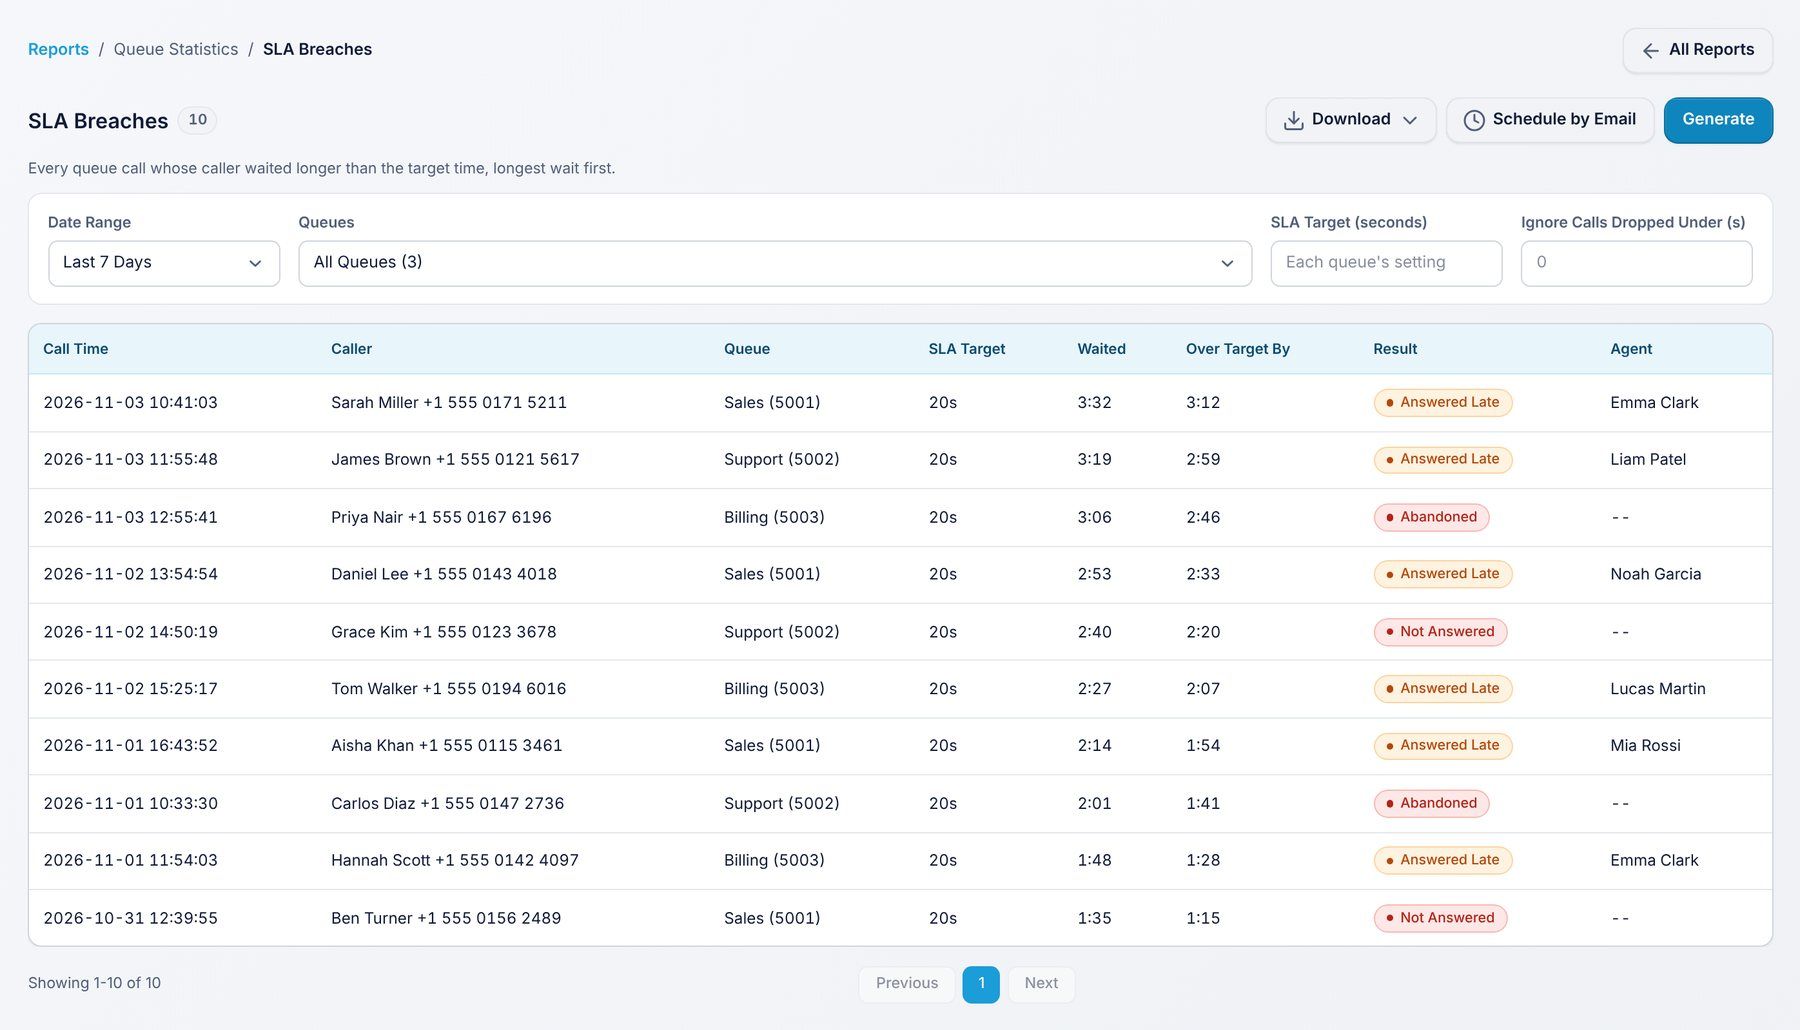
Use it to: review each call that missed the target, and when it happened.
Filters: Date range, Queue, SLA target, Ignore short calls.
Missed and abandoned callers, and whether each one was called back.
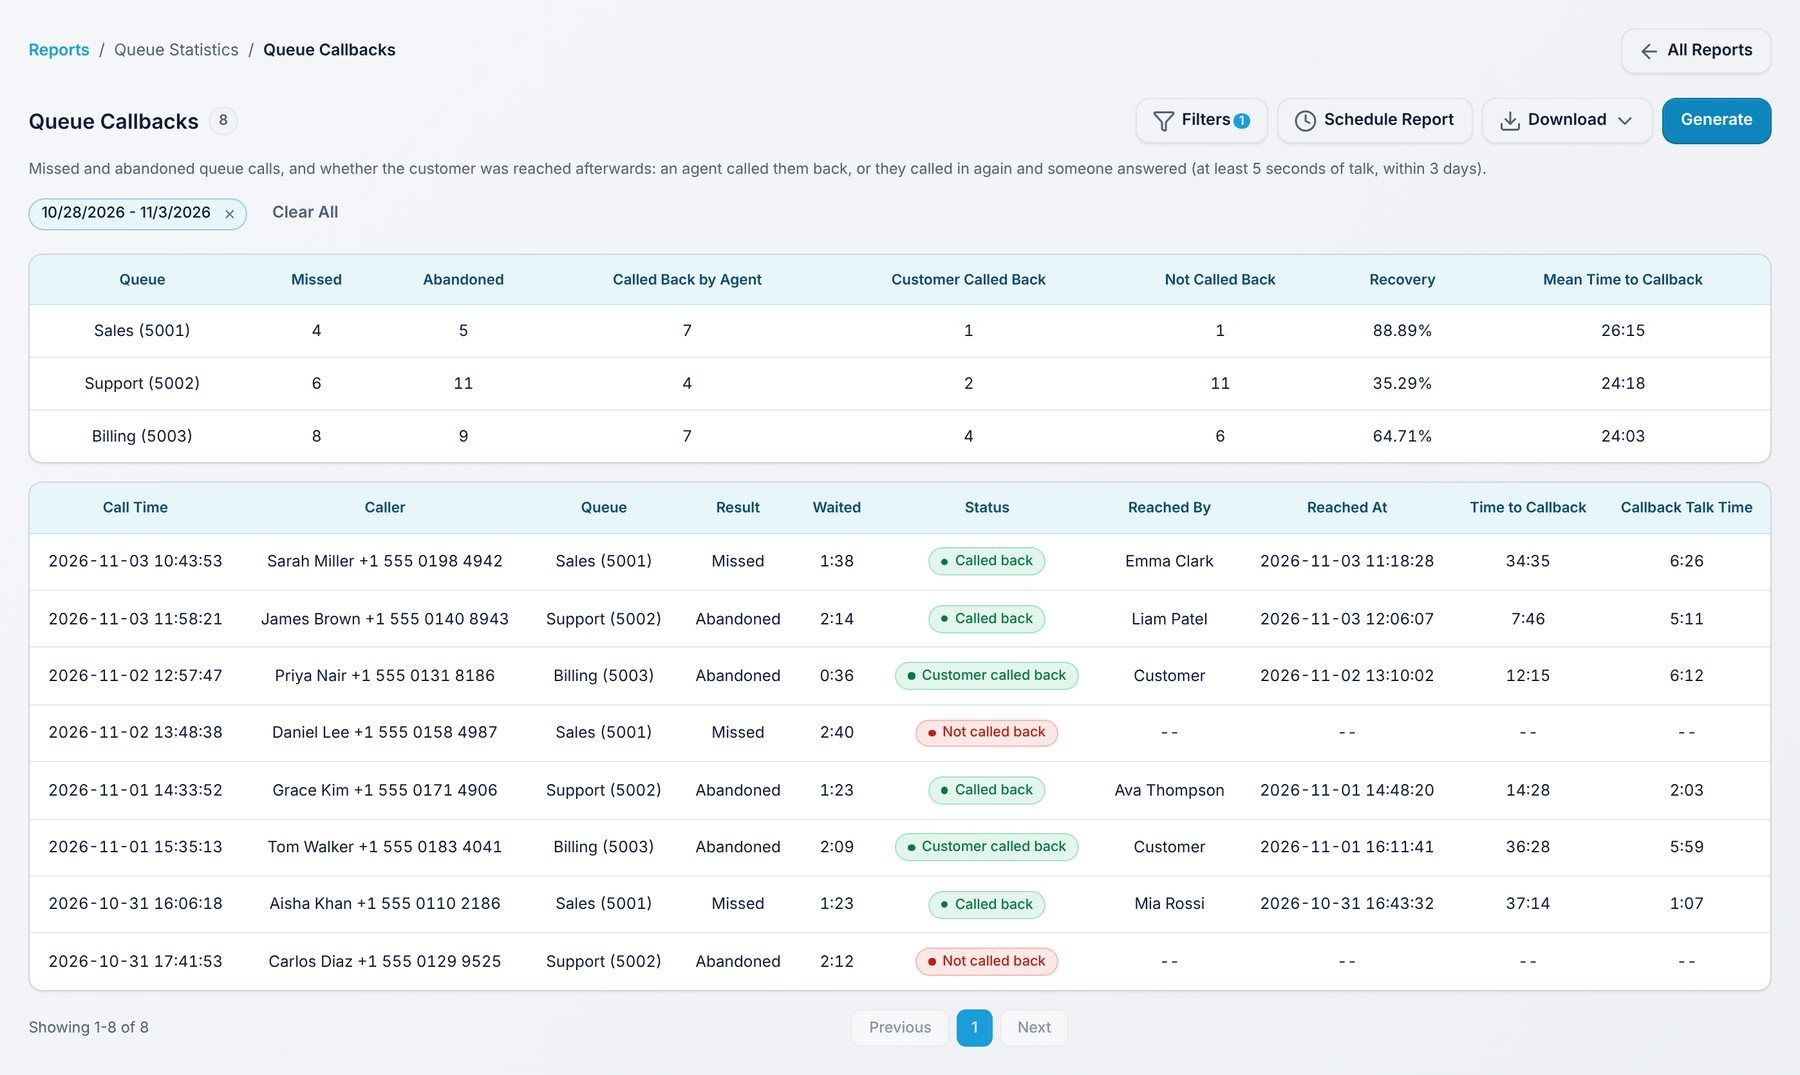
Use it to: make sure no missed caller is forgotten.
Filters: Date range, Queue.
A team view of each queue: the agents on it, calls per agent and busy time.
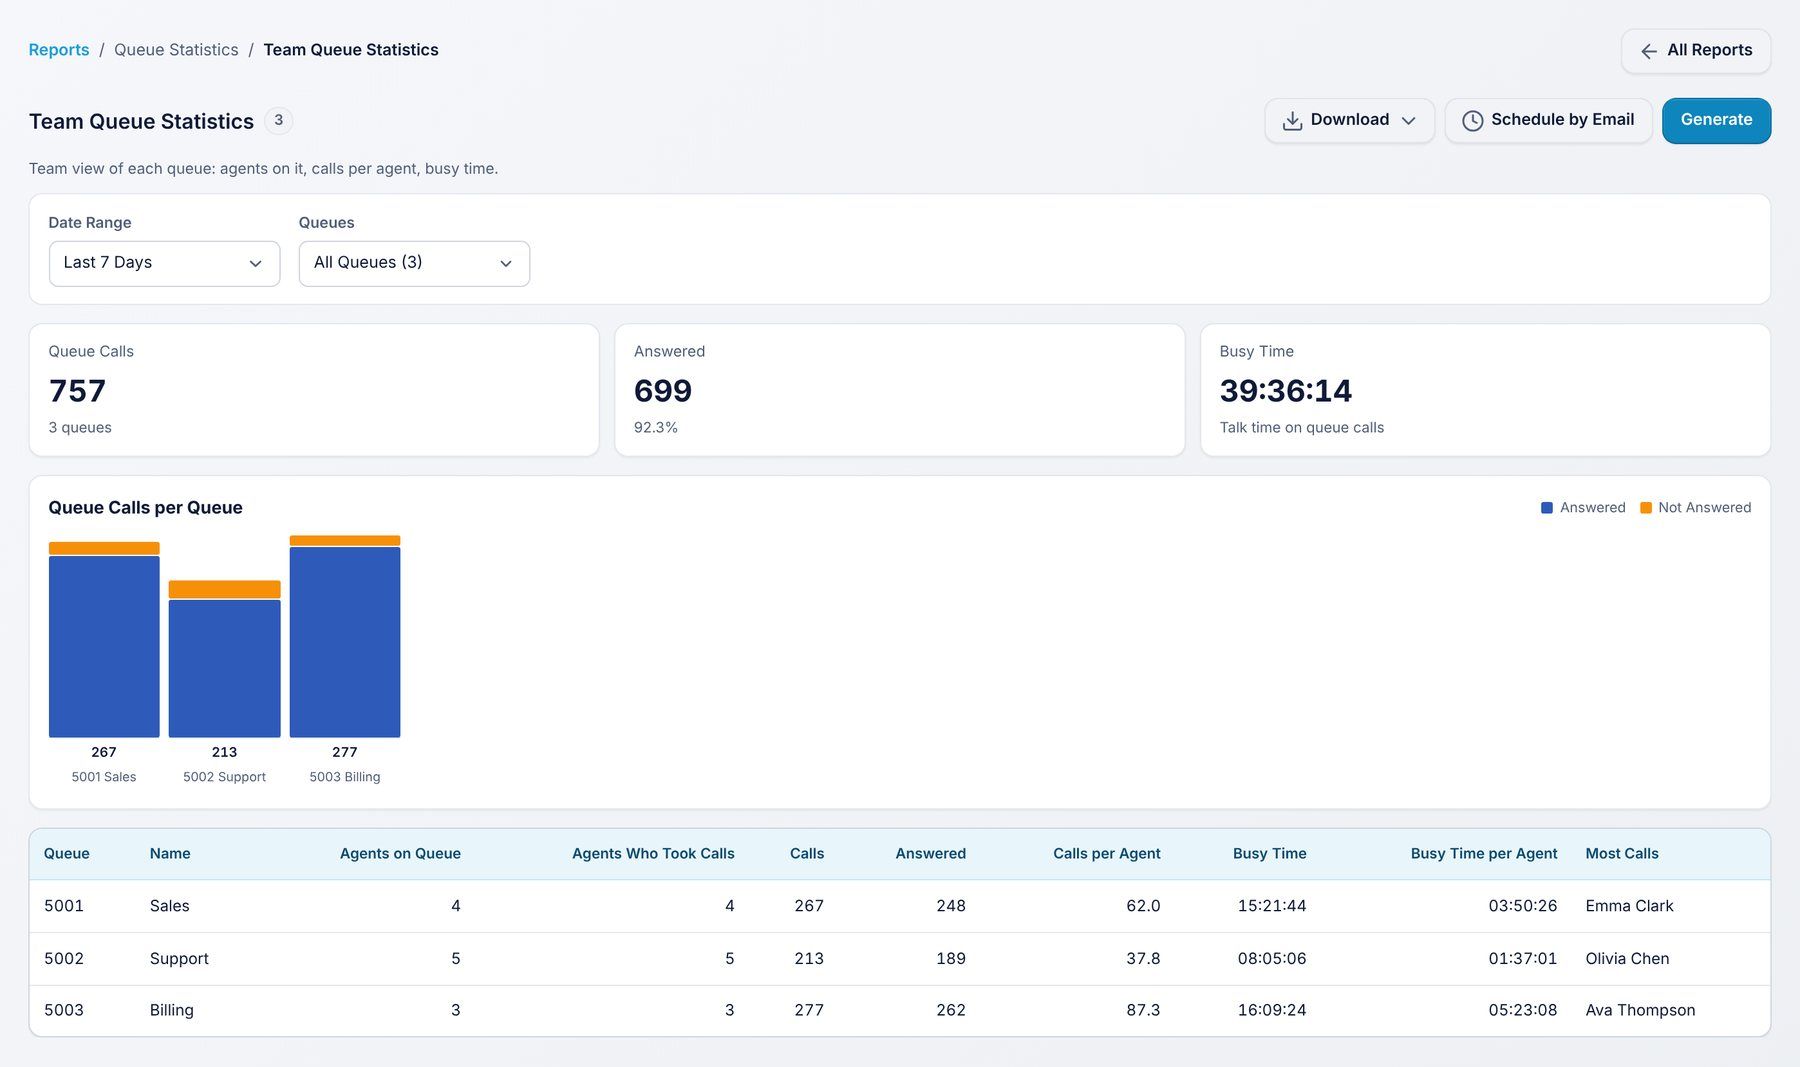
Use it to: see how the work is shared across a team.
Filters: Date range, Queue.
Every report has the same buttons:
