This guide provides an overview of the RingQ System Dashboard, detailing the layout, purpose, and function of each component. It is designed to help administrators and partners effectively monitor system performance, license status, and extension activity.
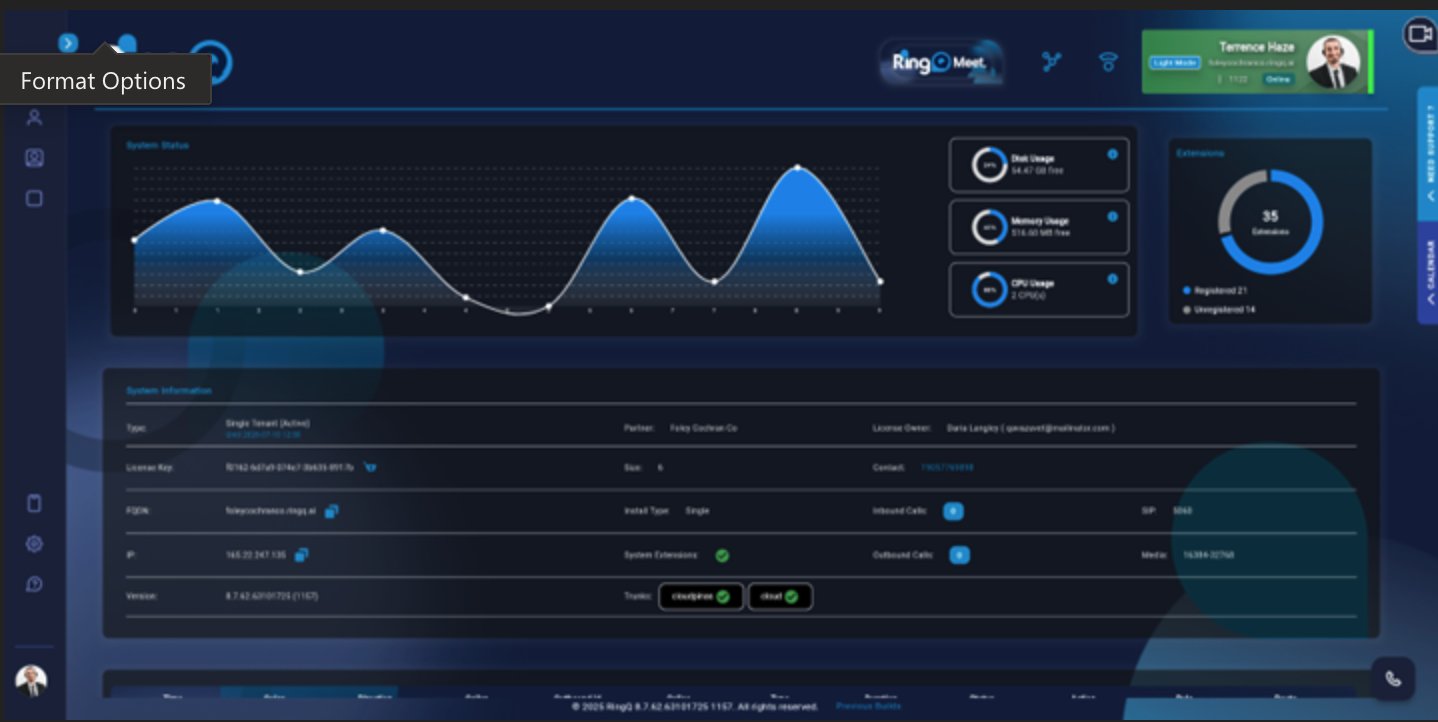
Displays real-time system performance metrics across different operational hours.
These indicators show the current usage of server resources hosting your RingQ instance.
| Metric | Description | Details |
|---|---|---|
| Disk Usage | Indicates used and available storage. | Example: “24% – 54.50 GB free” means 24% of disk capacity is used, leaving 54.50 GB available. |
| Memory Usage | Shows the RAM usage of the system. | Example: “42% – 395.02 MB free” indicates moderate memory utilization. |
| CPU Usage | Reflects processing activity on the server. | Example: “17.2% – 2 CPU(s)” means two cores are active, with low CPU load. |
Monitors registration status of all RingQ extensions.
| Legend | Description |
|---|---|
| Registered (Blue) | Extensions currently connected and active. |
| Unregistered (Gray) | Extensions that are offline, unconfigured, or disconnected. |
Example: Total Extensions: 35; Registered: 21; Unregistered: 14.
This section provides complete deployment and license information for your RingQ instance.
| Field | Description |
|---|---|
| License Expiry | Deployment type. “Single Tenant (Active)” means this RingQ instance is dedicated to a single client or organization. |
| License Key | Unique system license ID. The copy icon 📋 allows you to duplicate it for activation or support requests. |
| Partner | The company or entity managing the RingQ deployment (e.g., Foley Cochran Co). |
| License Owner | The registered system owner and email contact (e.g., Daria Langley – qavazuvet@mailinator.com). |
| Contact | Support or technical contact number for the deployment. |
| Size | The maximum number of users, extensions, or licenses allocated to this system. |
| FQDN (Fully Qualified Domain Name) | Your system’s unique web address (e.g., foleycochranco.ringq.ai). |
| IP Address | The public IP address of the server hosting the RingQ instance. |
| Install Type | Specifies whether the installation is Single or Clustered. |
| Inbound Calls | Current number of incoming calls (live metric). |
| Outbound Calls | Current number of outgoing calls. |
| SIP Port | Network port used for SIP signaling (e.g., 5060). |
| Media Ports | Range used for RTP media streams (e.g., 16384–32768). |
| Version | The current software build installed (e.g., 8.7.62.63101725 (1157)). |
| System Extensions | Indicates if internal system extensions are active (✓ means operational). |
| Trunks | Displays registered trunk connections, such as cloudpinas or cloud, with ✓ showing active registration. |
| Icon | Function |
|---|---|
| 📋 | Copy to clipboard |
| ✅ | Indicates a successful or active connection (Trunks, Extensions) |
| ✉️ | Message Counter |
Check System Usage Weekly
Review Extension Status Daily
Validate License & Version
Backup Configuration Regularly
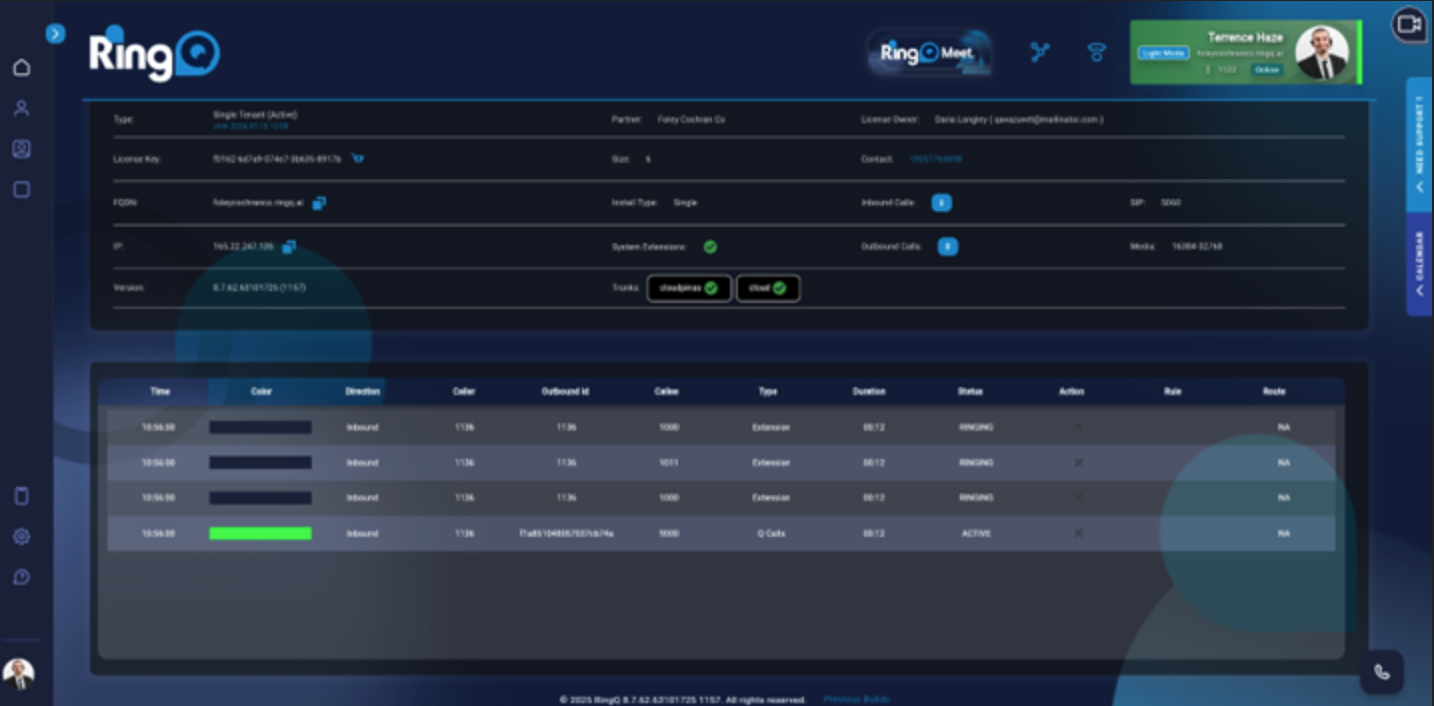
This panel displays real-time and historical call activity for monitoring and troubleshooting.
| Column | Description |
|---|---|
| Time | Timestamp of the call (e.g., 10:56:00). |
| Color | Visual indicator of call status (e.g., green = active). |
| Direction | Indicates whether the call is Inbound or Outbound. |
| Caller | Extension or number that initiated the call. |
| Outbound ID | System-assigned unique ID for outbound tracking. |
| Callee | The destination number or extension being called. |
| Type | Type of connection (e.g., Extension, Q Cells). |
| Duration | Length of the call (e.g., 00:12). |
| Status | Current call state (RINGING, ACTIVE, ENDED). |
| Action | Allows termination (❌) or management of ongoing calls. |
| Rule | Indicates any routing rules applied (NA = none). |
| Route | Shows active call path (NA = default route). |
This table is ideal for real-time monitoring, queue observation, and diagnostics.
This dashboard gives a comprehensive real-time overview of your RingQ PBX system, focusing on:
Together, these elements allow administrators to maintain uptime, monitor performance, and quickly detect anomalies.
