Having the right information at the right time can make the difference between smooth operations and costly inefficiencies. This is where a wallboard application becomes an essential tool for contact centres, customer service teams, and communications-driven organisations. A wallboard provides a visual, real-time display of key performance indicators (KPIs), helping teams monitor activity, respond to changes, and make informed decisions instantly.
What is a Wallboard?
A wallboard application is a digital dashboard that displays live and historical performance data on a large screen or multiple screens within an office environment. Traditionally, wallboards were physical boards with manually updated figures. Today, modern wallboard applications are software-based, pulling real-time data directly from communication systems such as UCaaS platforms, call centres, and CRM tools.
Wallboards typically showcase metrics such as call volumes, waiting times, agent availability, queue lengths, abandoned calls, service levels, and overall team performance. They are designed to be highly visual, easy to read from a distance, and continuously updated without manual intervention.
Rather than requiring managers to generate reports or manually track performance, a wallboard provides a constantly updating snapshot of what is happening in real time across teams and departments.
How Does a Wallboard Work?
A wallboard application connects directly to a business’s communication or call management system. It continuously gathers real-time data and presents it in a clear, visual format through charts, graphs, and colour-coded indicators.
The system refreshes automatically, ensuring that what is displayed is always up to date. Many wallboard applications also store historical data, allowing managers to analyse trends over time, compare performance across different periods, and identify patterns that can inform future decision-making.
Modern wallboards can be customised to display only the most relevant metrics for each team or department. For example, a customer support team may focus on response times and call handling efficiency, while a sales team might prioritize outbound call success rates and lead engagement metrics.
Some wallboards can also be displayed across multiple screens in different locations, ensuring that both frontline teams and management have visibility of performance wherever they are working.
Key Benefits of a Wallboard Application
Implementing a wallboard application brings several operational advantages:
- Improved Visibility: Teams have instant access to performance data without needing to generate reports or log into multiple systems.
- Faster Decision-Making: Managers can react in real time to staffing needs, spikes in call volume, or service issues.
- Enhanced Accountability: When performance metrics are visible to everyone, teams are more aware of their targets and responsibilities.
- Better Customer Experience: By monitoring service levels and response times, businesses can reduce wait times and improve overall customer satisfaction.
- Data-Driven Optimisation: Historical data helps organisations refine workflows, staffing schedules, and service strategies over time.
A wallboard also encourages a more performance-driven culture. When key metrics are visible to the entire team, employees are more engaged with their results and motivated to meet or exceed expectations.
Who Needs a Wallboard?
A wallboard application is particularly valuable for organisations that rely heavily on communication and customer interaction. This includes:
- Call centres and contact centres
- Customer support teams
- Sales departments handling high call volumes
- Help desks and IT support teams
- Operations teams managing service queues
- Financial institutions and service providers with customer-facing teams
Any business that wants greater transparency, improved efficiency, and better performance management can benefit from using a wallboard application. Even smaller teams can gain value from real-time visibility into how they are performing.
RingQ’s Wallboard: Simple, Powerful, and Visual
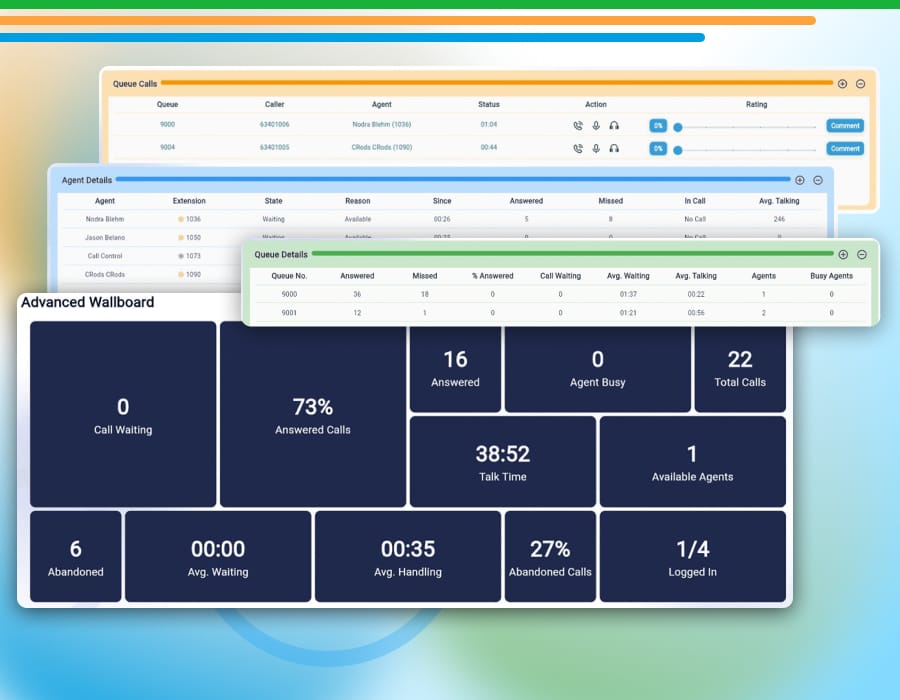
RingQ, as a UCaaS platform, includes a built-in wallboard application designed to be both powerful and user-friendly. Unlike complex systems that require technical expertise, RingQ’s wallboard is easy to configure using a simple drag-and-drop interface. This allows managers and team leaders to build customized dashboards quickly, without needing specialist IT support.
Users can select the metrics they want to display, arrange them visually on the screen, and tailor the layout to suit different teams or business needs. This flexibility makes RingQ’s wallboard suitable for everything from small customer service teams to larger multi-department contact centres.
The RingQ wallboard is also colour-coded, making it easier to interpret data at a glance. For example, metrics can change colour based on performance thresholds—such as green for good performance, amber for caution, and red for areas needing immediate attention. This visual approach helps teams spot issues instantly and act before problems escalate.
Additionally, RingQ’s wallboard supports both real-time monitoring and historical data analysis, giving businesses a complete view of their performance over time. Managers can review past trends, assess performance improvements, and make more informed operational decisions.
For organisations looking to explore this functionality, RingQ offers a free trial, allowing users to experience the wallboard application firsthand, test its features, and see how it can enhance their operations before committing to a full deployment.