Introduction
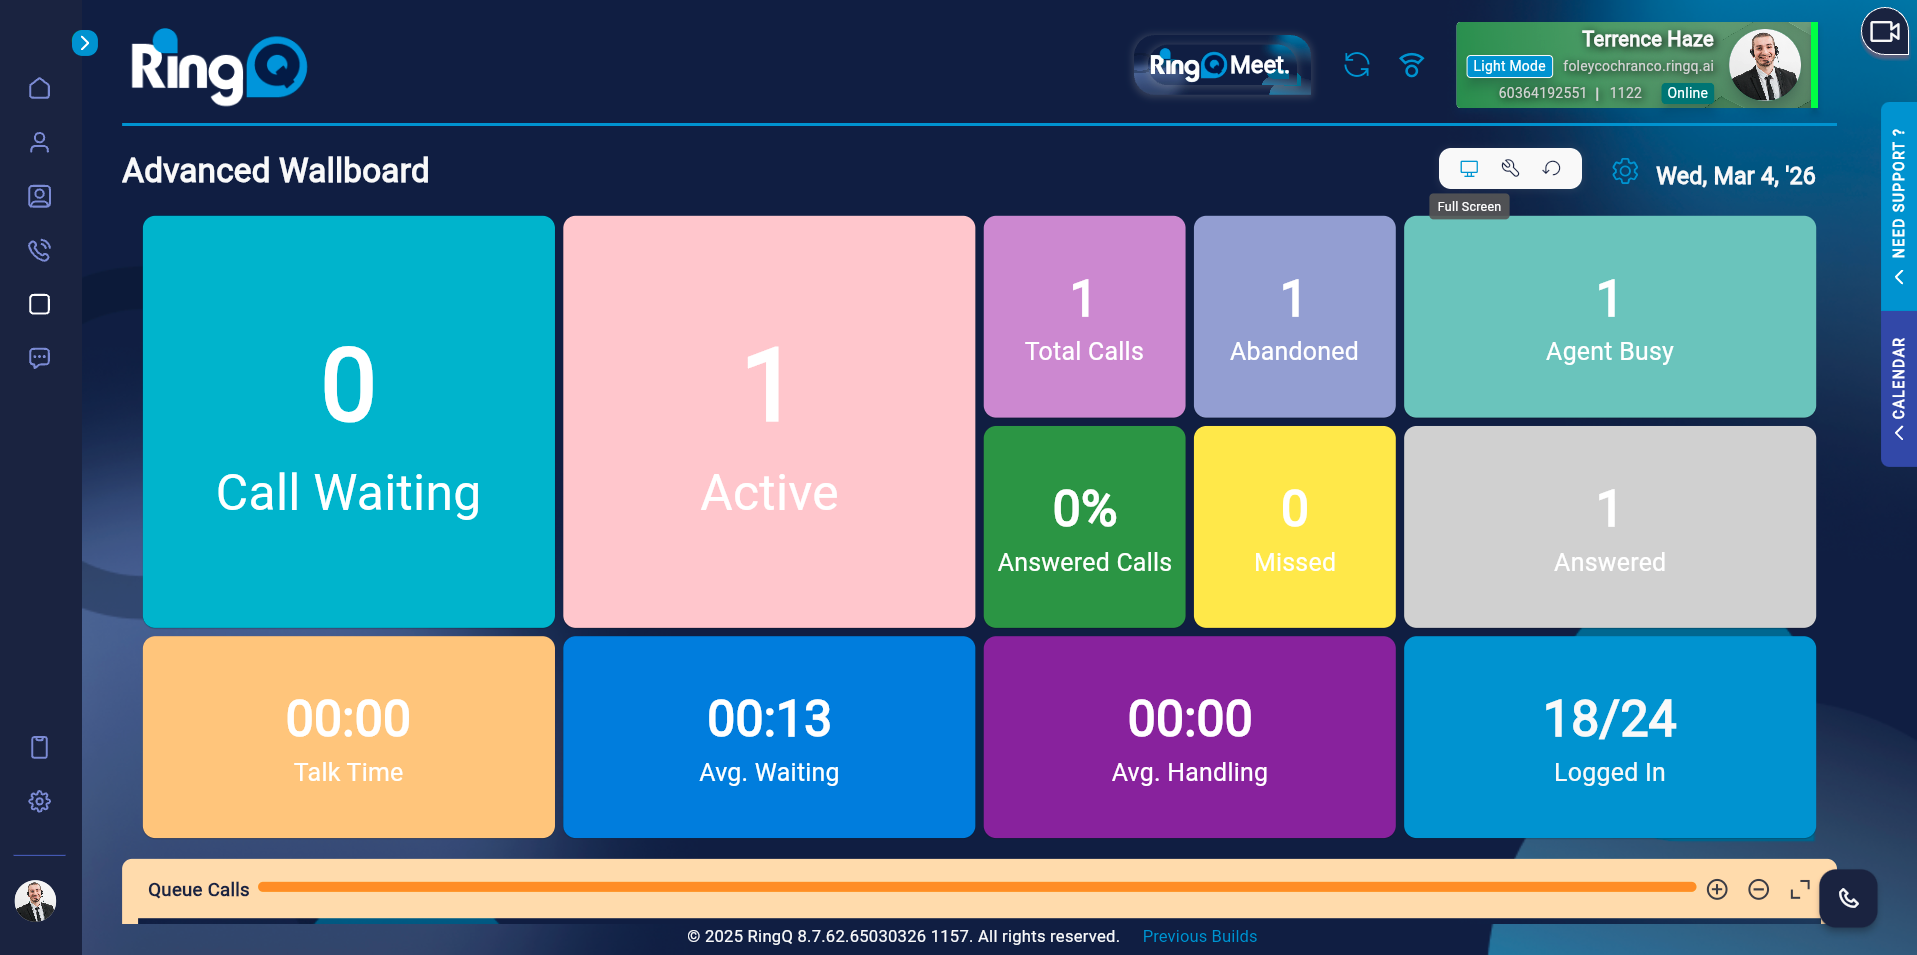
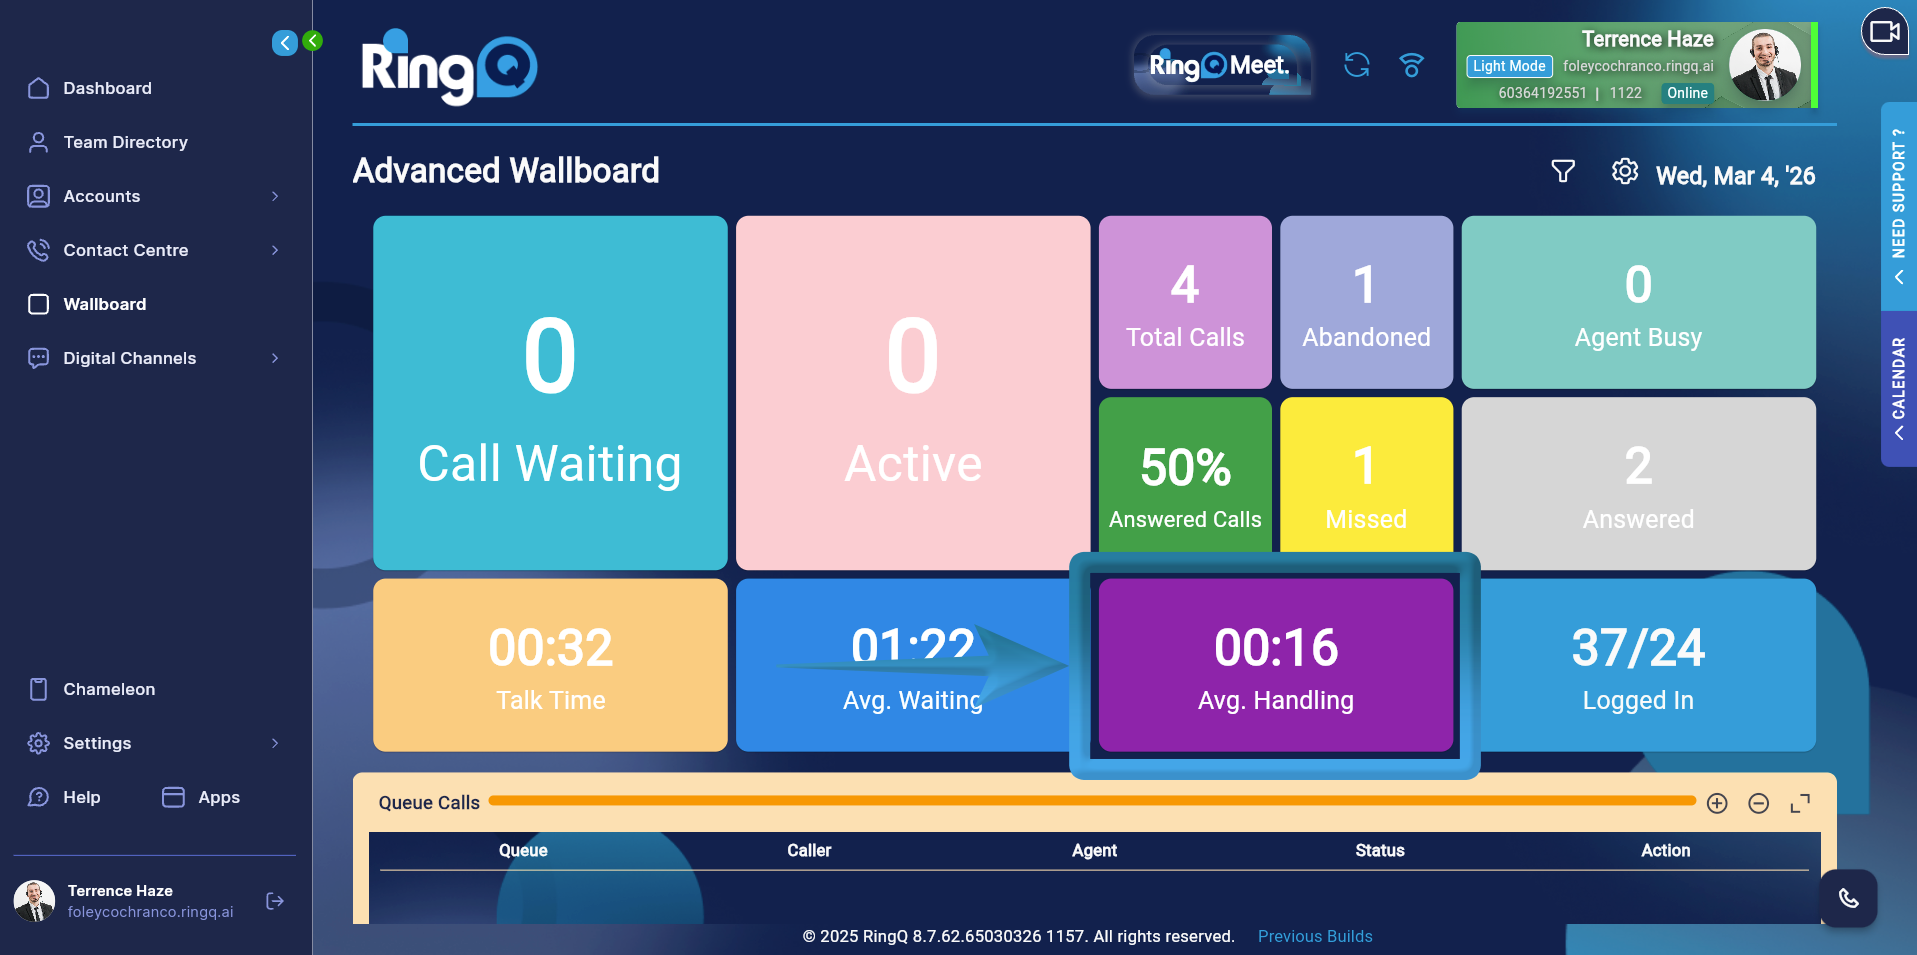
The RingQ Advanced Wallboard provides a real-time dashboard showing key call queue metrics such as call volume, wait times, answered vs. missed calls, and agent availability. It helps supervisors quickly monitor performance, manage call traffic, and maintain high service levels. This guide explains how to set up and use the Wallboard.
Assigning Extensions to the Wallboard
The Advanced Wallboard can be found in the sub-section of the Contact Center and can only be accessed by the Owner, Manager, and Supervisor. 1. Log in to RingQ and go to “Settings”. 2. Select “Call Flow”. 3. Drag and drop the Available DID to the Queue container. 4. Assign an existing queue. 5. Click the save button. 6. Select the assigned DID from the existing queue. 7. Go to Notifications. 8. Click the drop-down button. 9. Select your extension number. 10. Click the save button to update the changes.
Wallboard Options
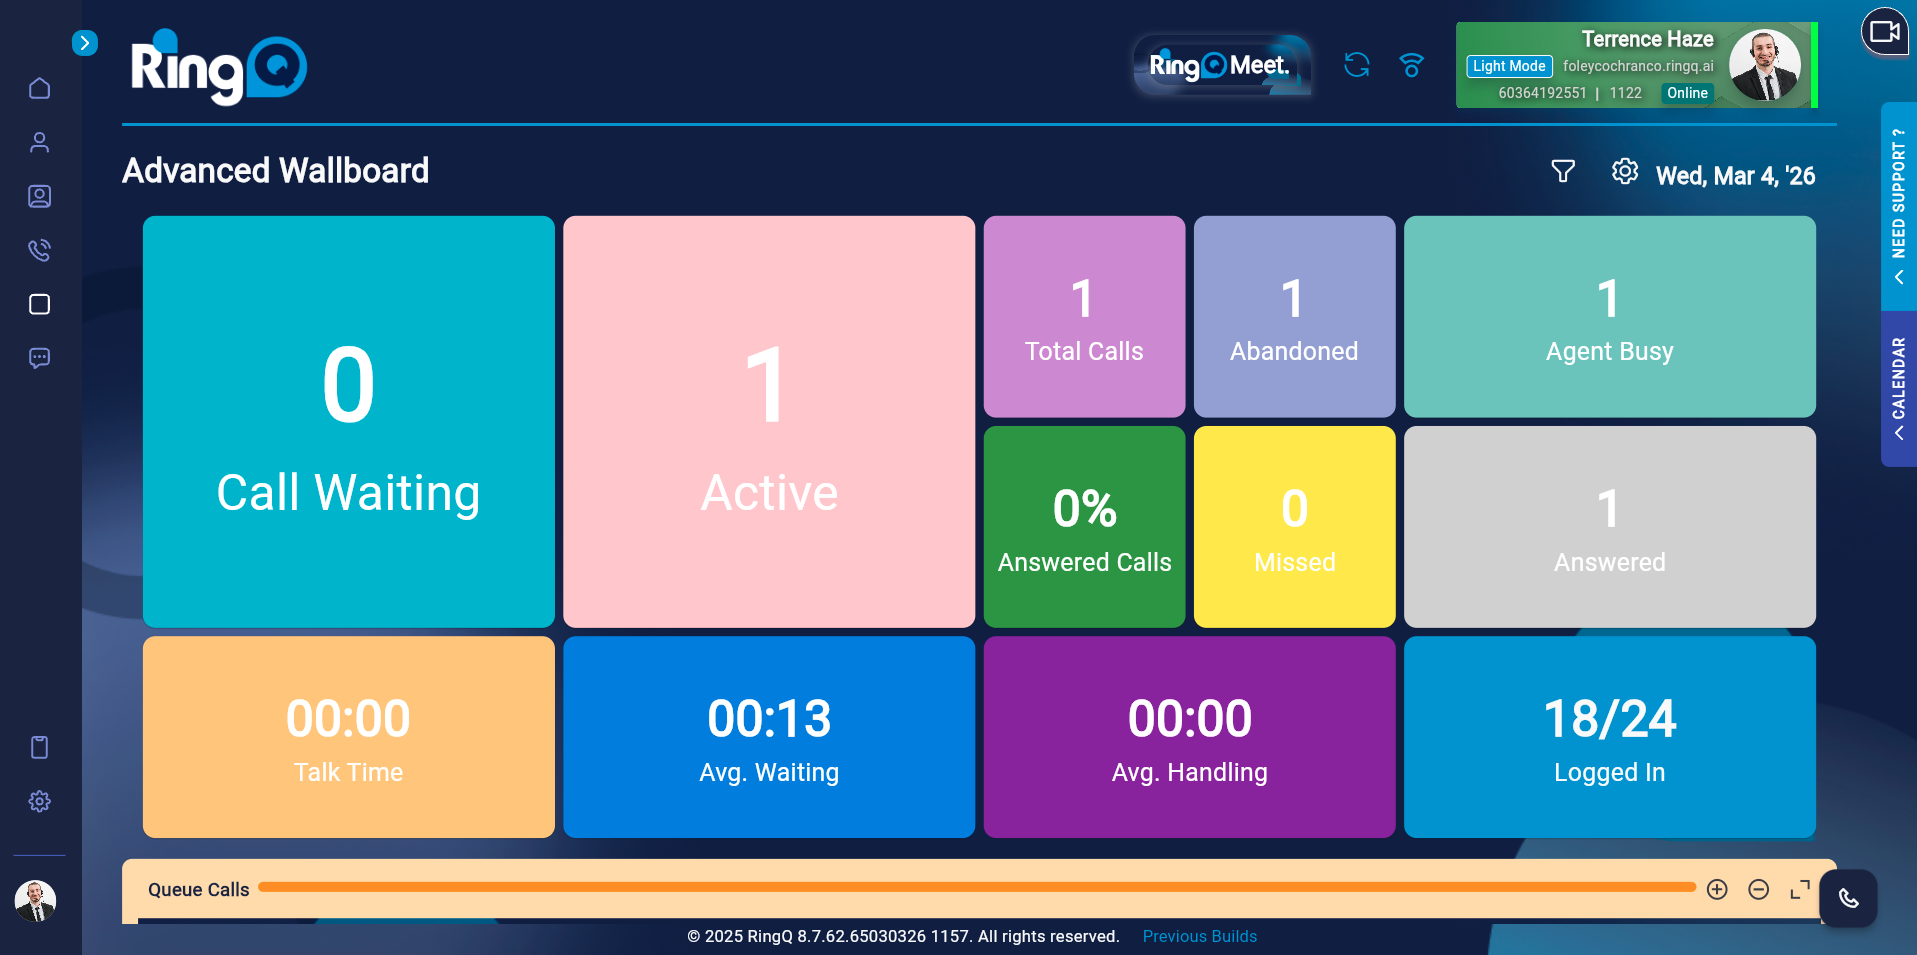
- Enabling Full Screen
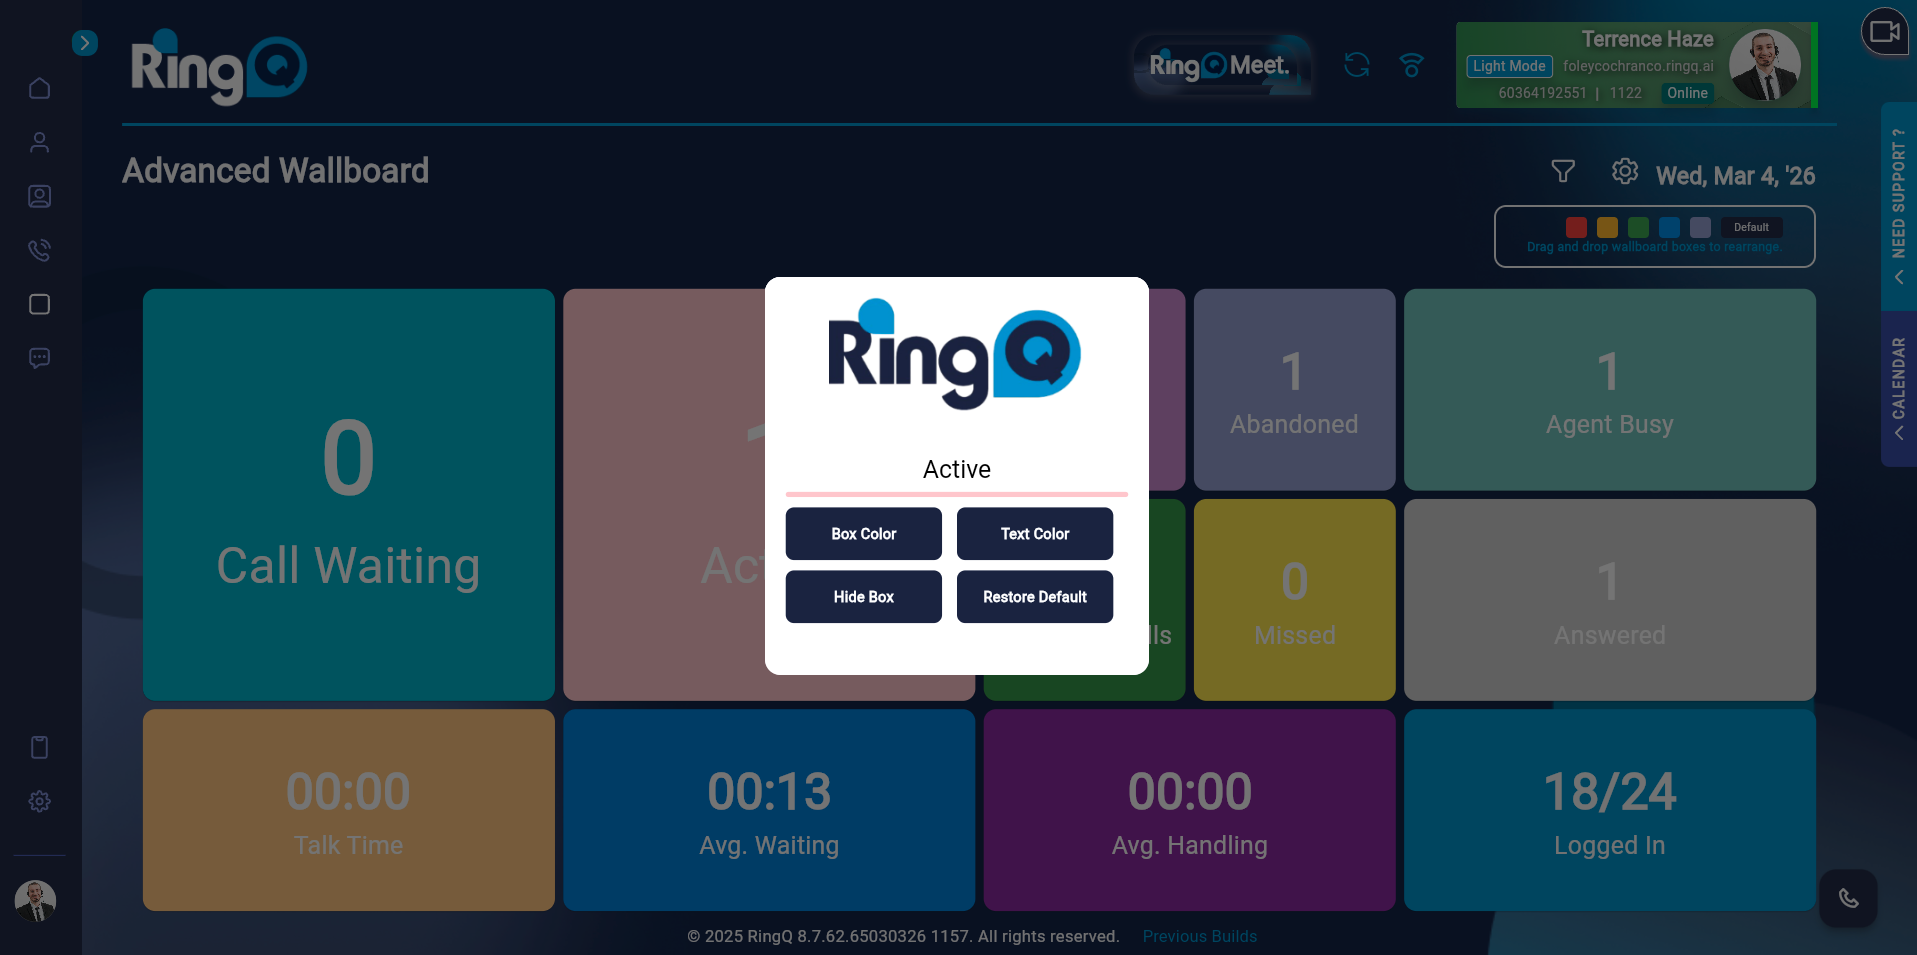
- All the colors of the box are customizable.
- Every box’s color can be changed.
- The color of the text can be changed.
- The box can be hidden.
- The default settings can also be restored.
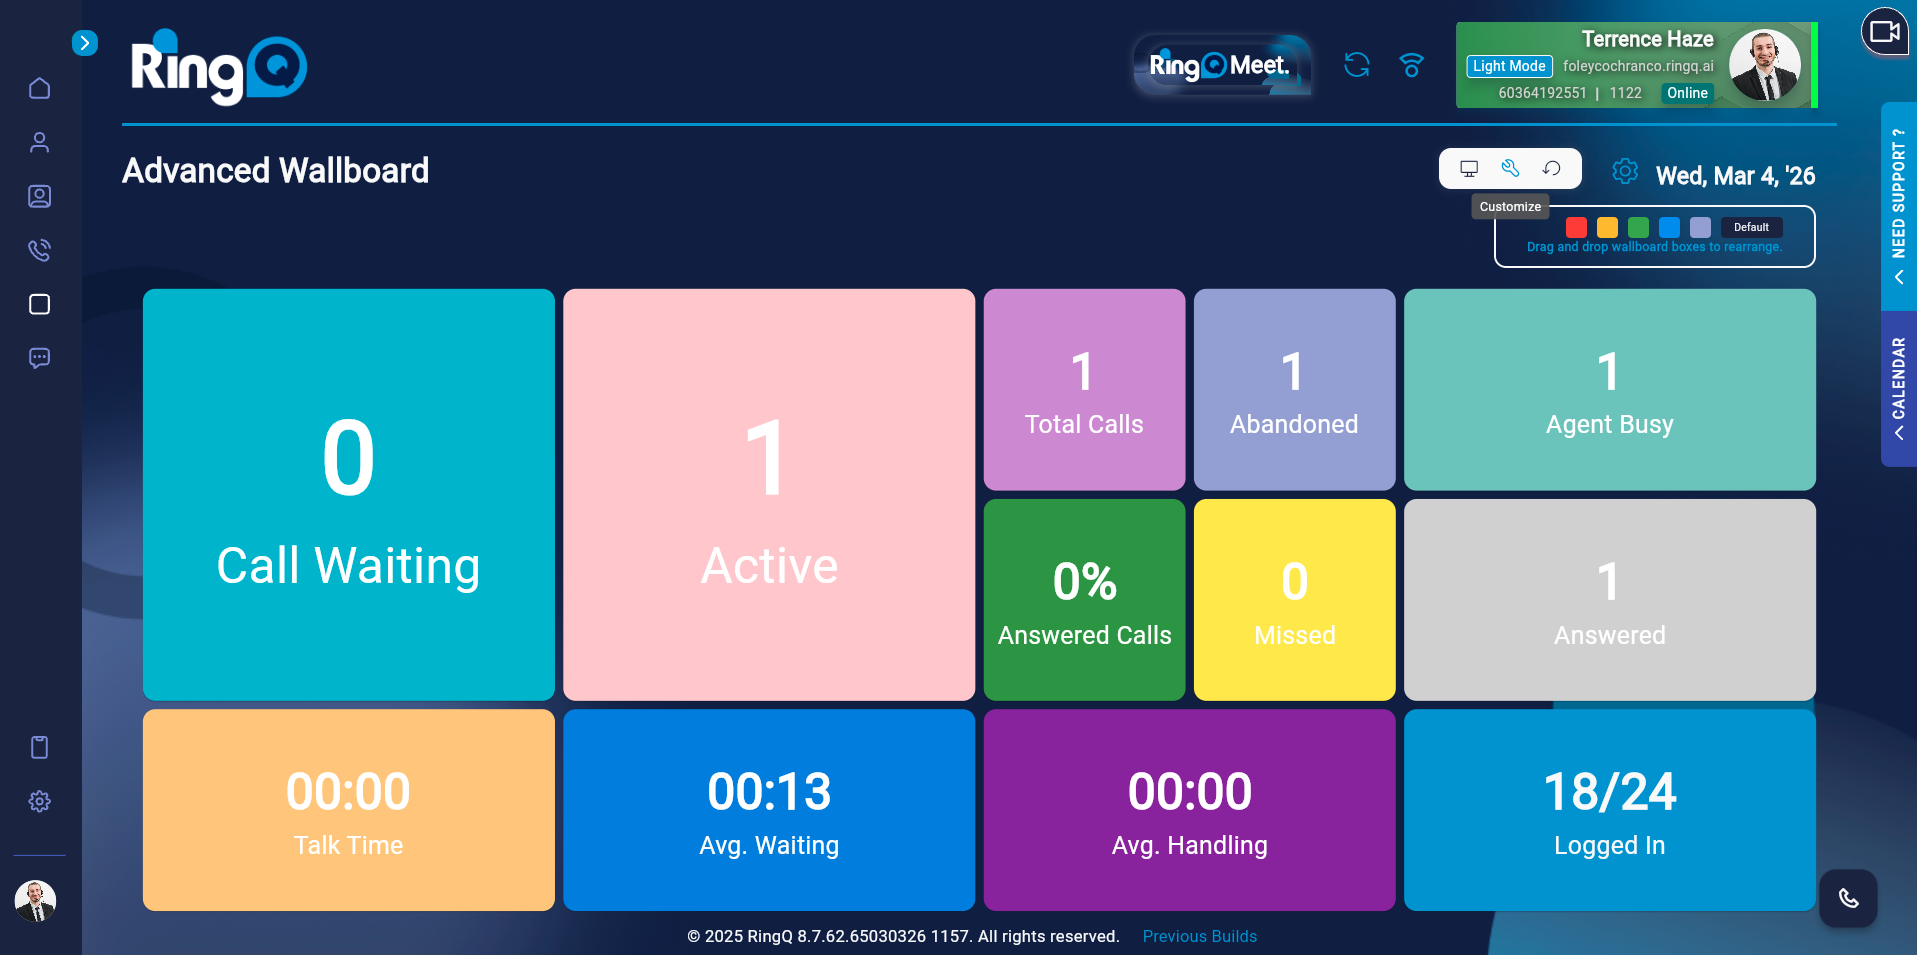
- Additionally, you can erase all of the wallboard’s data.
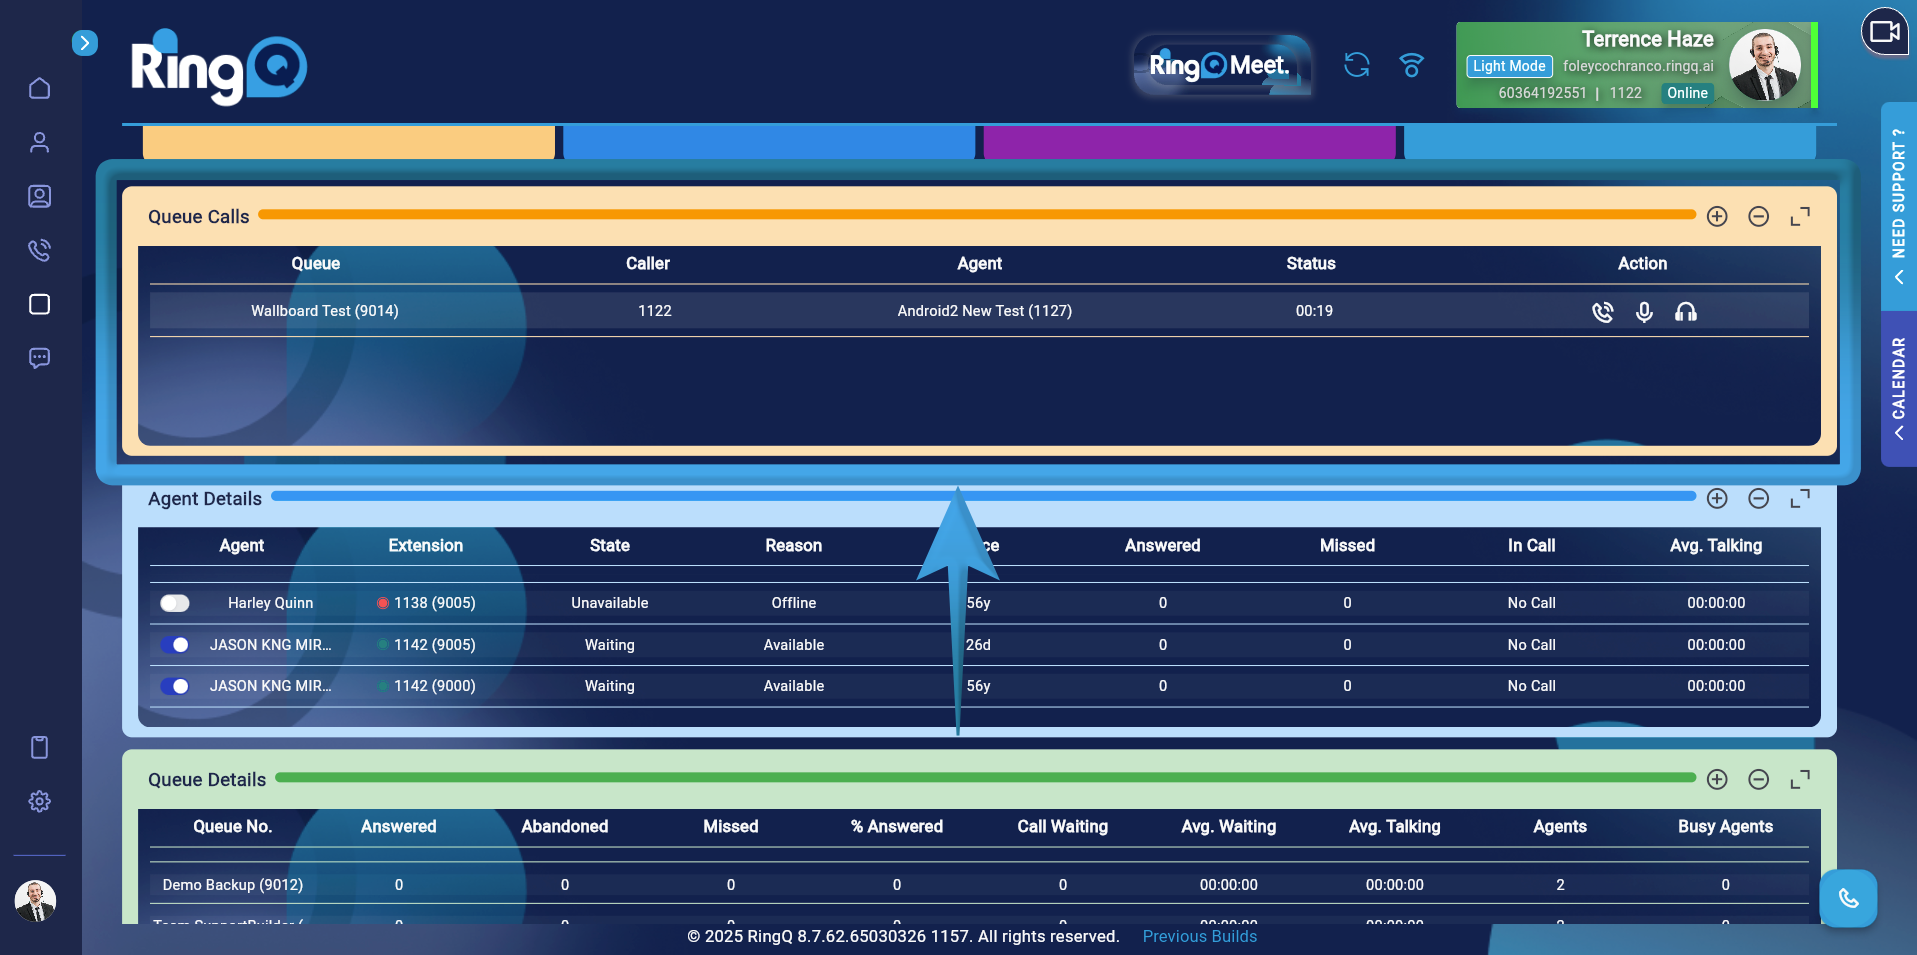
- The Queue Calls Chart, Agent Details Chart, and Queue Details Chart can all be resized to your preferred size.
- You can also rearrange the boxes positions
Wallboard Data
- Call Waiting – Shows the number of calls waiting in the queue.
- Answered Calls – Shows the number of calls that have been answered.
- Abandoned Calls – Shows the number of calls where the caller hung-up before the call was answered.
- Total Calls – Shows the total number of answered and abandoned calls.
- Percentage of Answered Calls.
- Percentage of Abandoned Calls.
- Average Waiting Time – The average amount of time a caller spends waiting in the queue.
- Average Handling Time – The average amount of time it takes for a call to be processed from the moment it enters the queue until it is answered by an available agent.
- Talk Time – The amount of time an agent spends speaking with a customer.
- Available Agents – The number of agents ready for calls.
- Logged In – The number of agents who are logged in to the queue.
- Agent Busy – The number of agents who are currently on a call.
Filtering Queues and Agents
To improve visibility and focus, Admins and Supervisors can apply filters to the Wallboard and control which queues/agents are displayed. 1. Click the Filter icon located at the top-right corner of the Wallboard. 2. Use the toggle buttons to select specific Queues and Agents to display. 3. Click “Okay” to update the Wallboard view instantly.
Takeover, Coach and Observe
- Takeover enables the supervisor to jump into or takeover a call queue.
- Coaching is giving agents direction, assistance, and coaching whilst they are on a call.
- Observe is actively monitoring the interactions between agents and customers in real-time as calls are being handled.
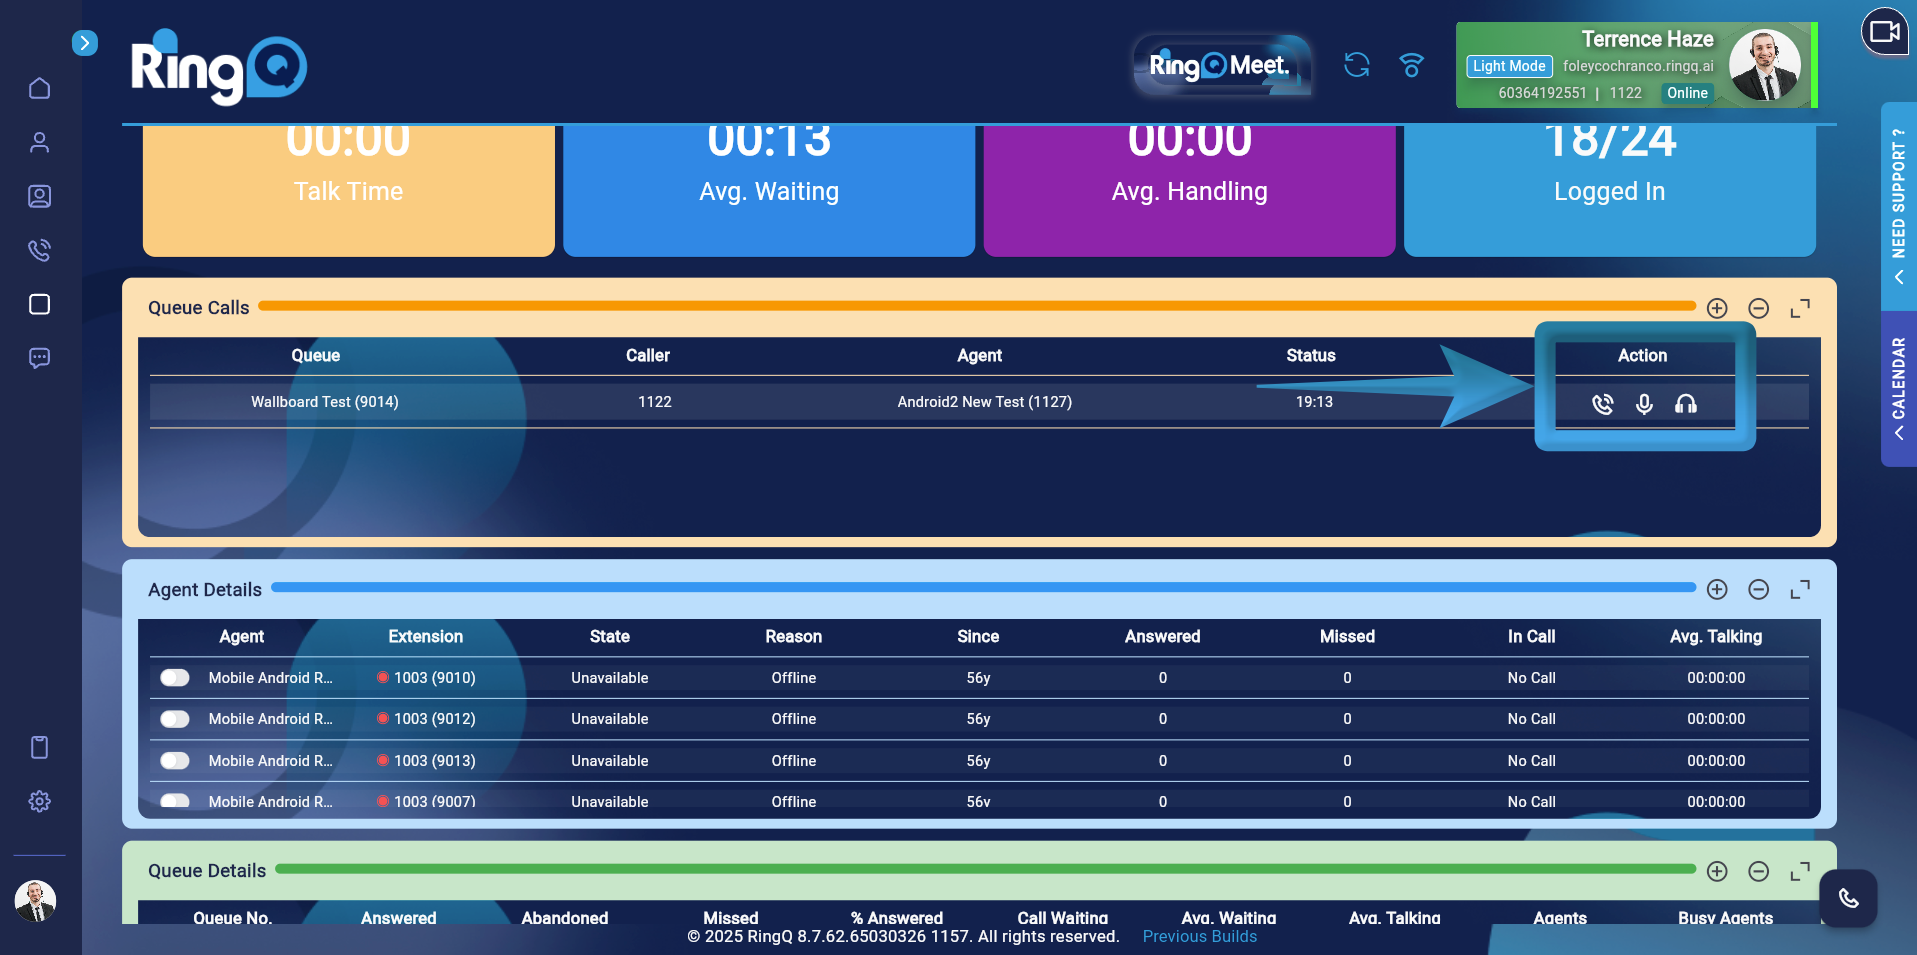
Queue Calls Chart Data
- Queue Extension
- Caller
- Agent
- Status – The duration of the conversation from the moment the call is connected to an agent until it ends.
- Action – These actions are the privilege of the Owner, Manager, and the Supervisor. Actions include Takeover, Coaching, and Observe.
- Rating – The feedback or assessment that a client leaves after speaking with an agent.
Agent Details Chart Data
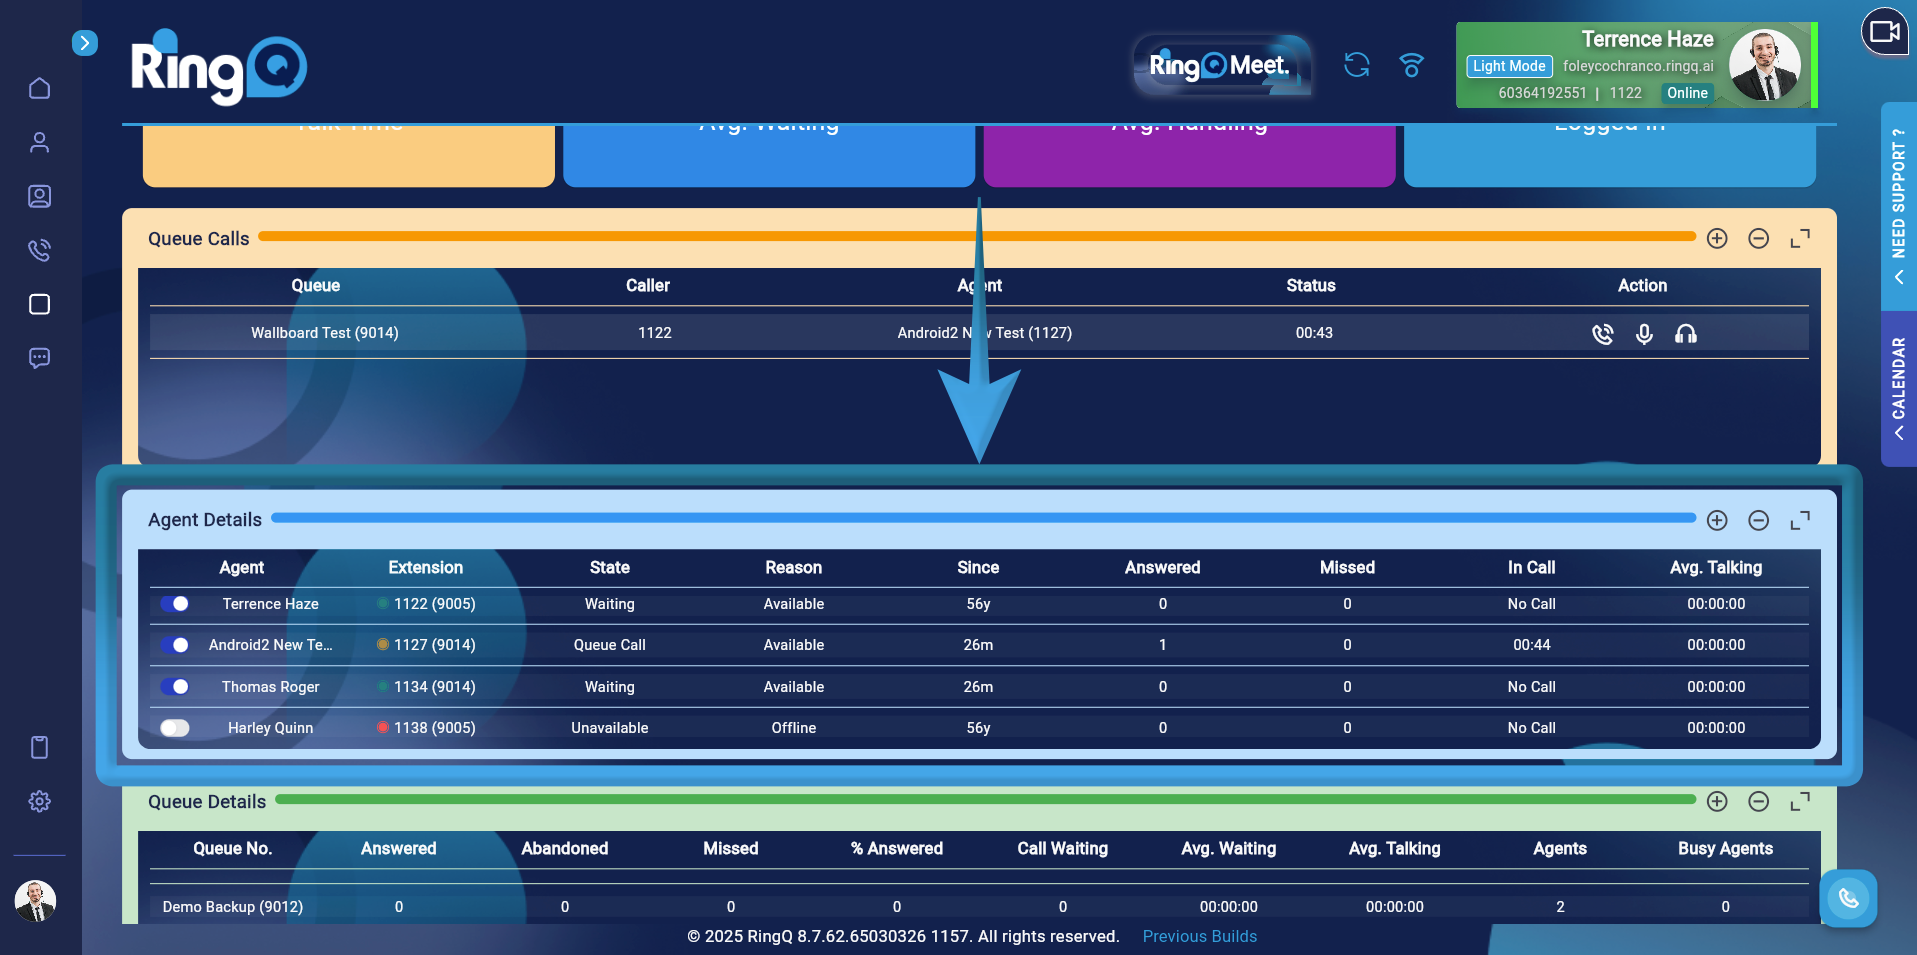
- Agent
- Extension
- State – Agent’s status whether Waiting, Receiving, Unavailable or in a Queue Call.
- Reason – Agent’s status inside the queue if Available, Receiving, Break, Logged out etc.
- Since – The duration of time the agent has been Available, Break, Logged out etc.
- Answered – Shows the total number of calls that attended by the agent.
- Missed – Shows the total number of calls that were unanswered by the agent.
- In Call – Shows the duration of the time the agent was on a call.
- Avg. Taking – The entire duration of the agent’s interaction with the caller.
Queue Details Chart Data
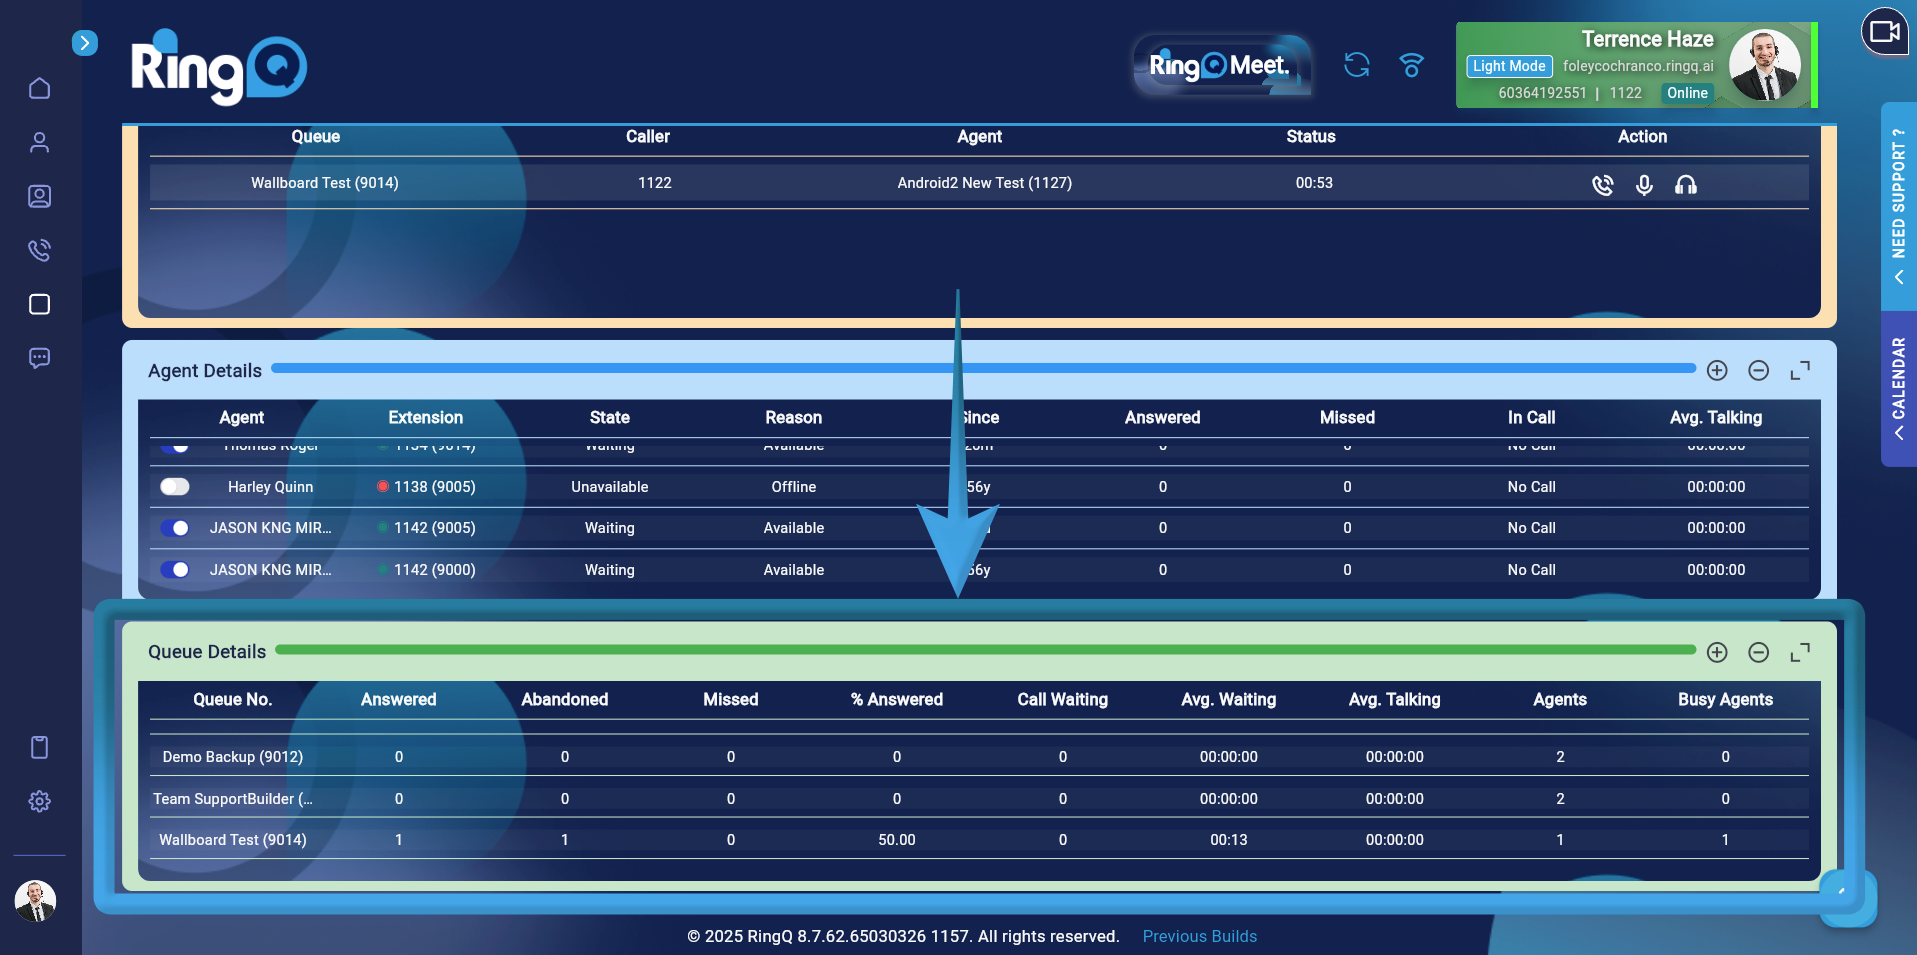
- Queue Name – Displays the name of the assigned agent in the queue.
- Queue Number – Displays the queue extension number.
- Answered – Displays all calls that have been answered in a queue.
- Missed – Displays a queue’s total number of missed calls.
- % Answered – Displays the percentage of calls in the entire queue that were answered.
- Average Talking – Displays the average conversation time.
- Call Waiting – Shows how long a call is waiting.
- Average Waiting – Displays an average wait time.
- Agents – Displays the average number of active agents.
- Busy Agents – Displays the number of agents in the queue who are currently on a call.
How Wallboard Metrics Are Calculated
The Advanced Wallboard in RingQ provides real-time and aggregated statistics for call center monitoring. Each metric displayed on the wallboard is calculated using specific formulas derived from call activity data. This guide explains how each metric is computed.
Call Waiting
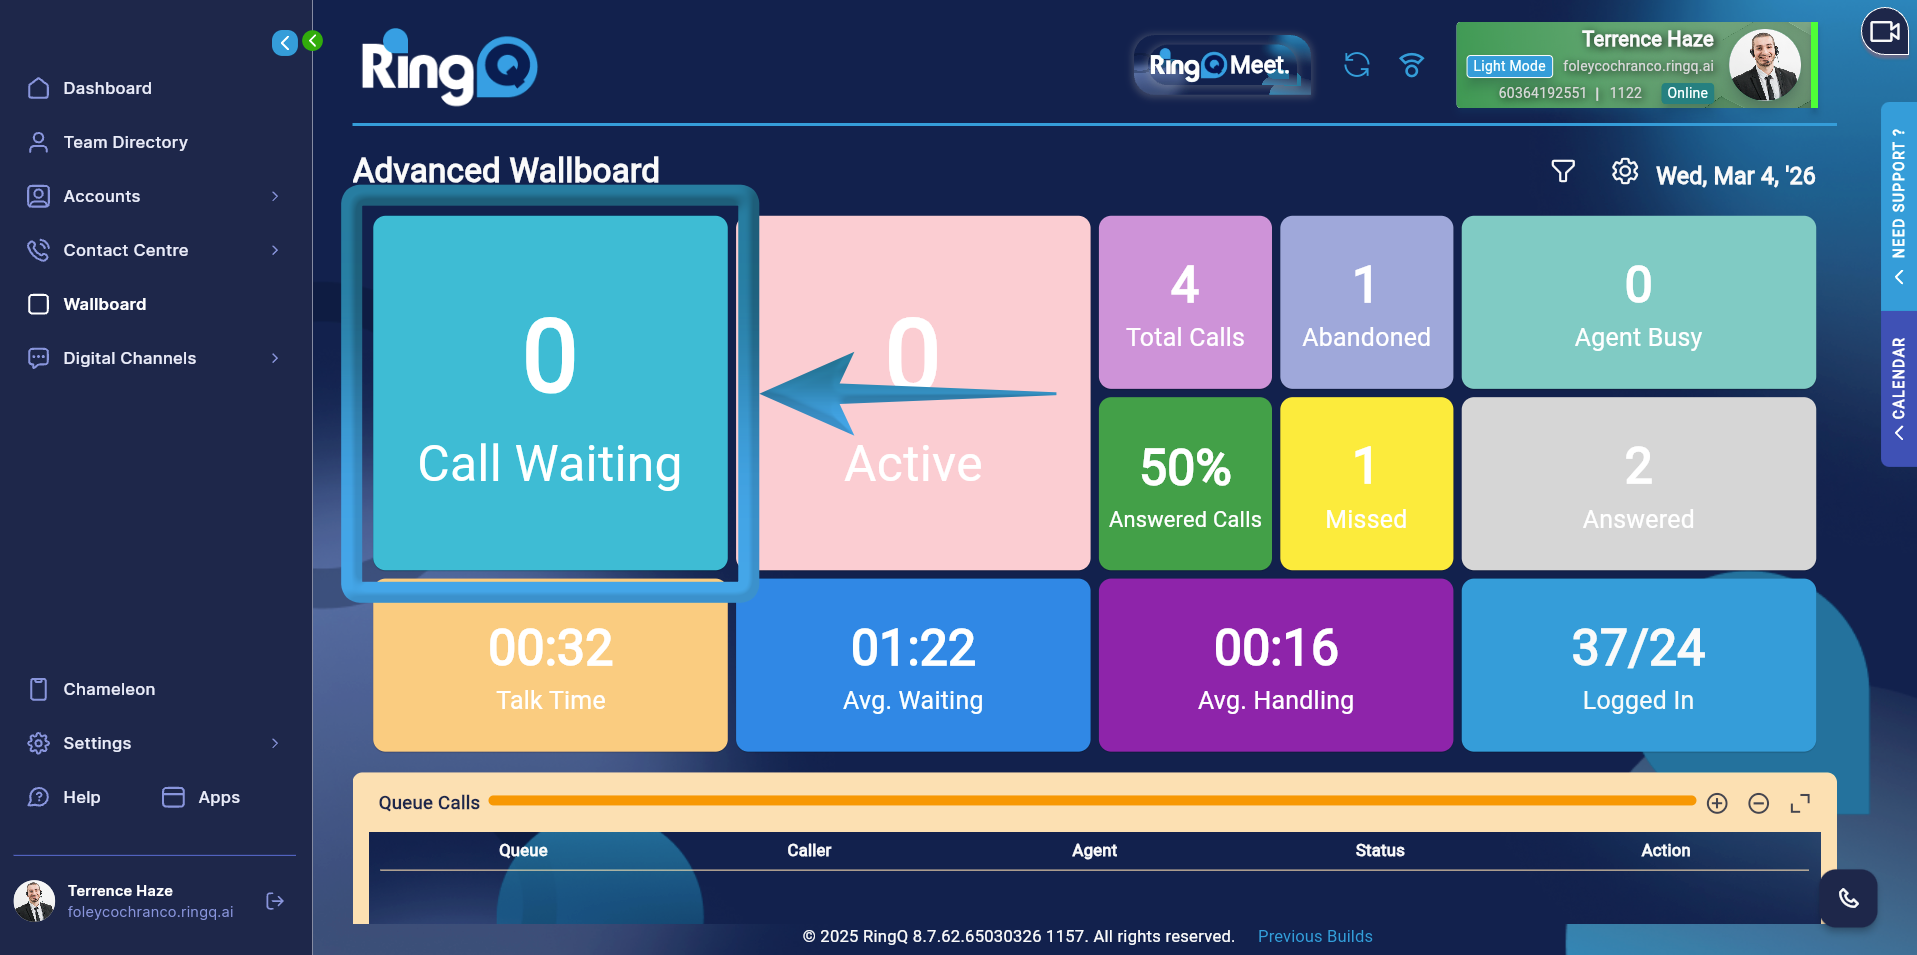 Displays the number of calls currently waiting in the queue that have not yet been answered by an agent.
Formula: CALL WAITING = SUM(waiting_wallboard)
The system aggregates all calls currently in the waiting state across the monitored queues.
Displays the number of calls currently waiting in the queue that have not yet been answered by an agent.
Formula: CALL WAITING = SUM(waiting_wallboard)
The system aggregates all calls currently in the waiting state across the monitored queues.
Active Calls
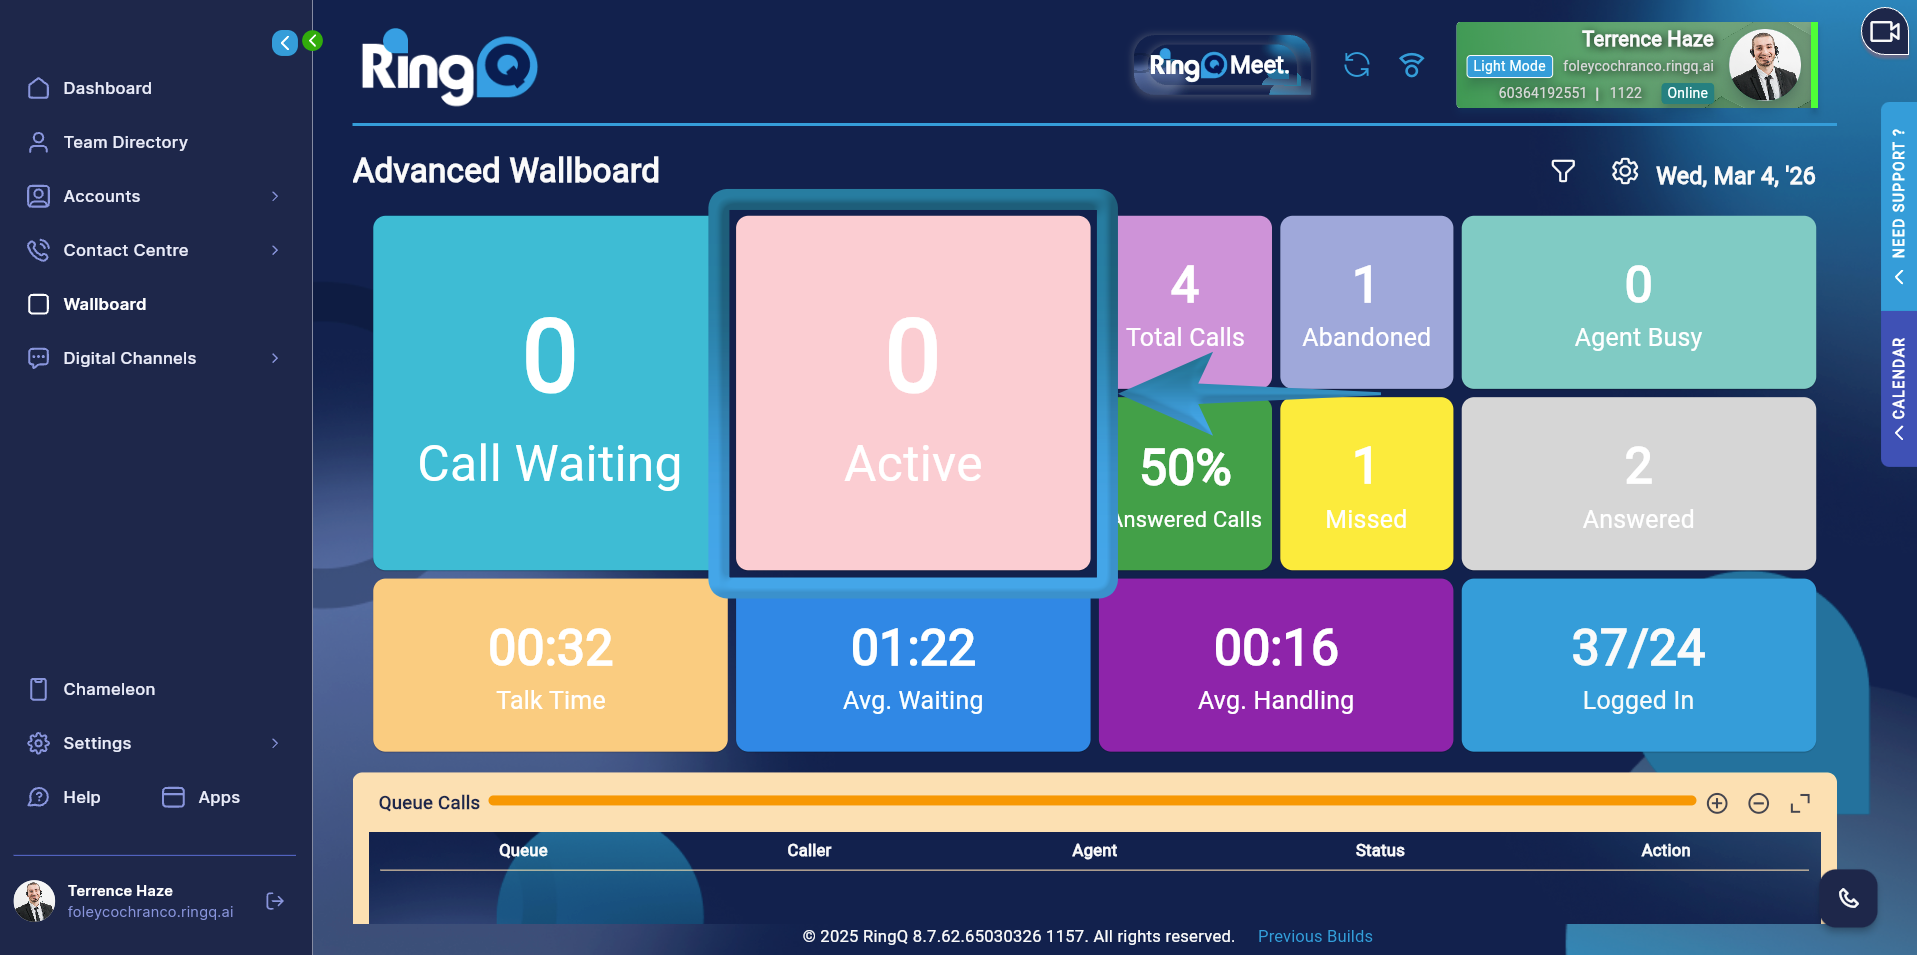 Shows the number of calls that are currently being handled by agents.
Formula: ACTIVE CALL = SUM(answered_wallboard)
This metric counts all calls that have already been answered and are currently active.
Shows the number of calls that are currently being handled by agents.
Formula: ACTIVE CALL = SUM(answered_wallboard)
This metric counts all calls that have already been answered and are currently active.
Total Calls
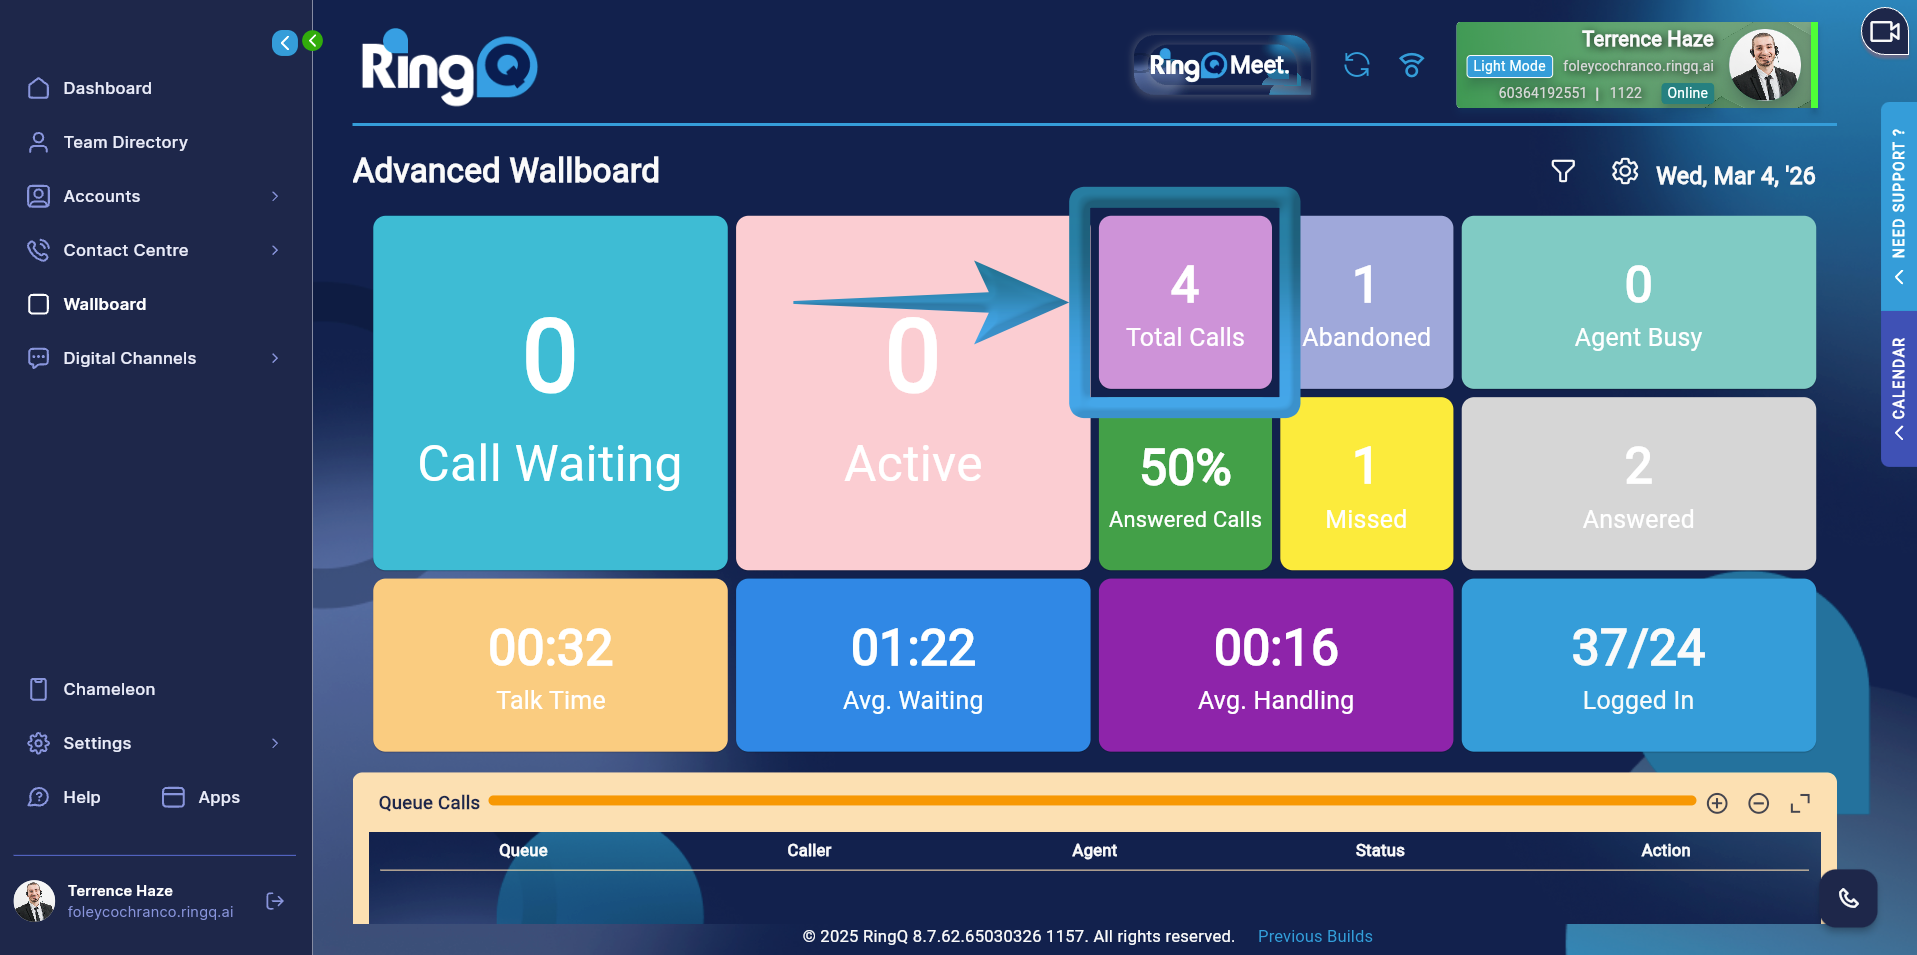 Displays the total number of calls received by the queue within the selected time range.
Formula: TOTAL CALLS = SUM(total_wallboard)
This value includes all incoming calls regardless of their final outcome (answered, abandoned, missed, etc.).
Displays the total number of calls received by the queue within the selected time range.
Formula: TOTAL CALLS = SUM(total_wallboard)
This value includes all incoming calls regardless of their final outcome (answered, abandoned, missed, etc.).
Abandoned Calls
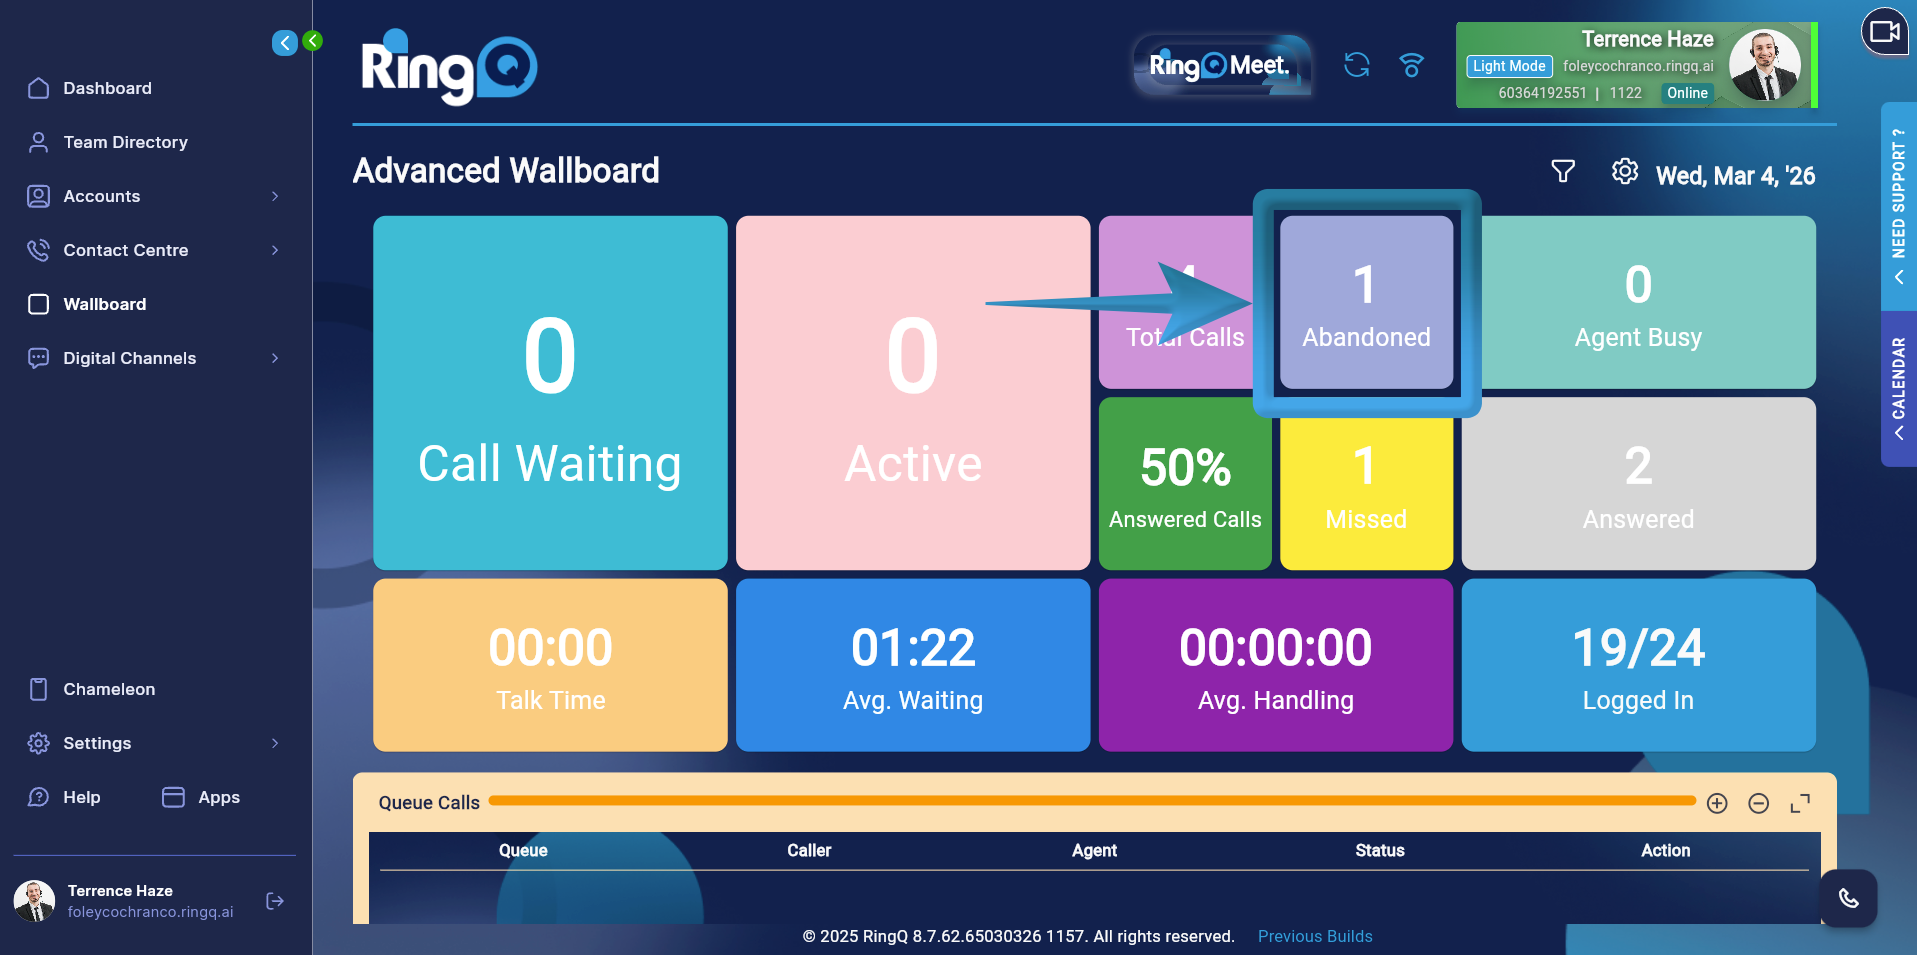 Shows the number of callers who disconnected before an agent answered the call.
Formula: ABANDONED = SUM(abandoned_wallboard)
Calls counted in this metric represent callers who left the queue before reaching an agent.
Shows the number of callers who disconnected before an agent answered the call.
Formula: ABANDONED = SUM(abandoned_wallboard)
Calls counted in this metric represent callers who left the queue before reaching an agent.
Missed Calls
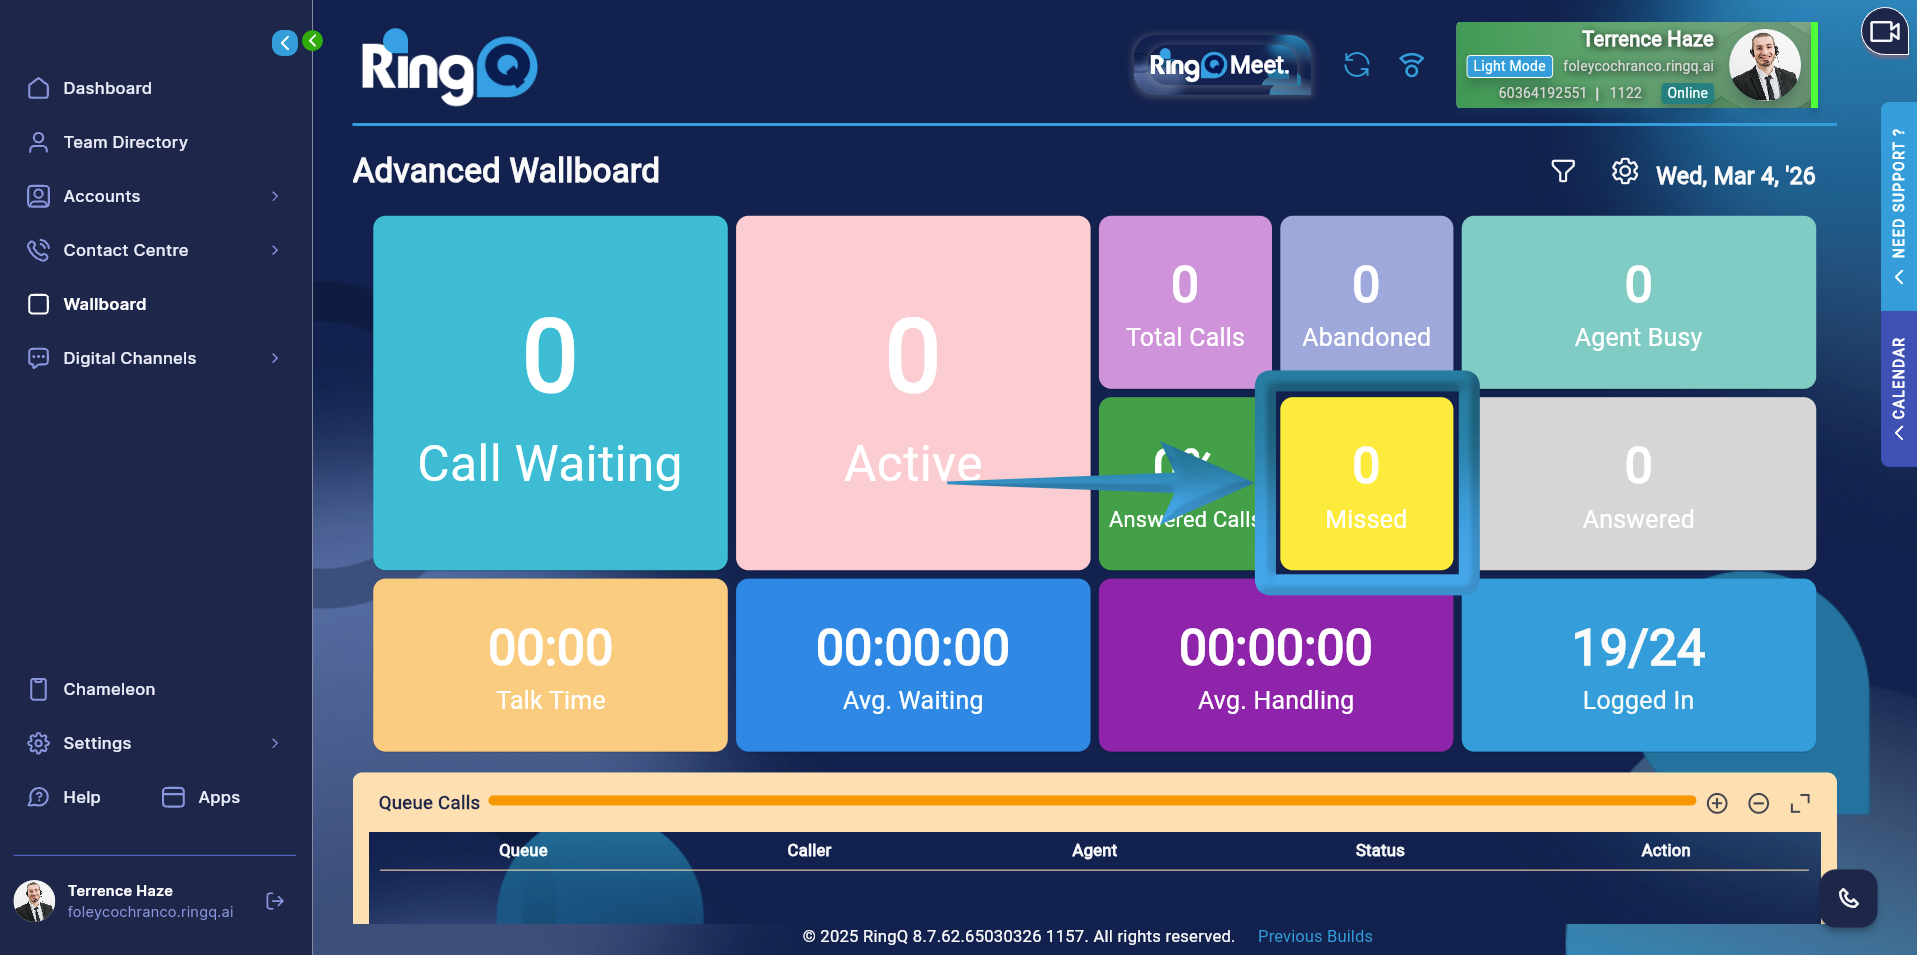 Displays the number of calls that were not successfully handled by agents.
Formula: MISSED = SUM(missed_calls)
Missed calls may include scenarios where no agent was available or the call was not answered within the expected timeframe.
Displays the number of calls that were not successfully handled by agents.
Formula: MISSED = SUM(missed_calls)
Missed calls may include scenarios where no agent was available or the call was not answered within the expected timeframe.
Answered Calls
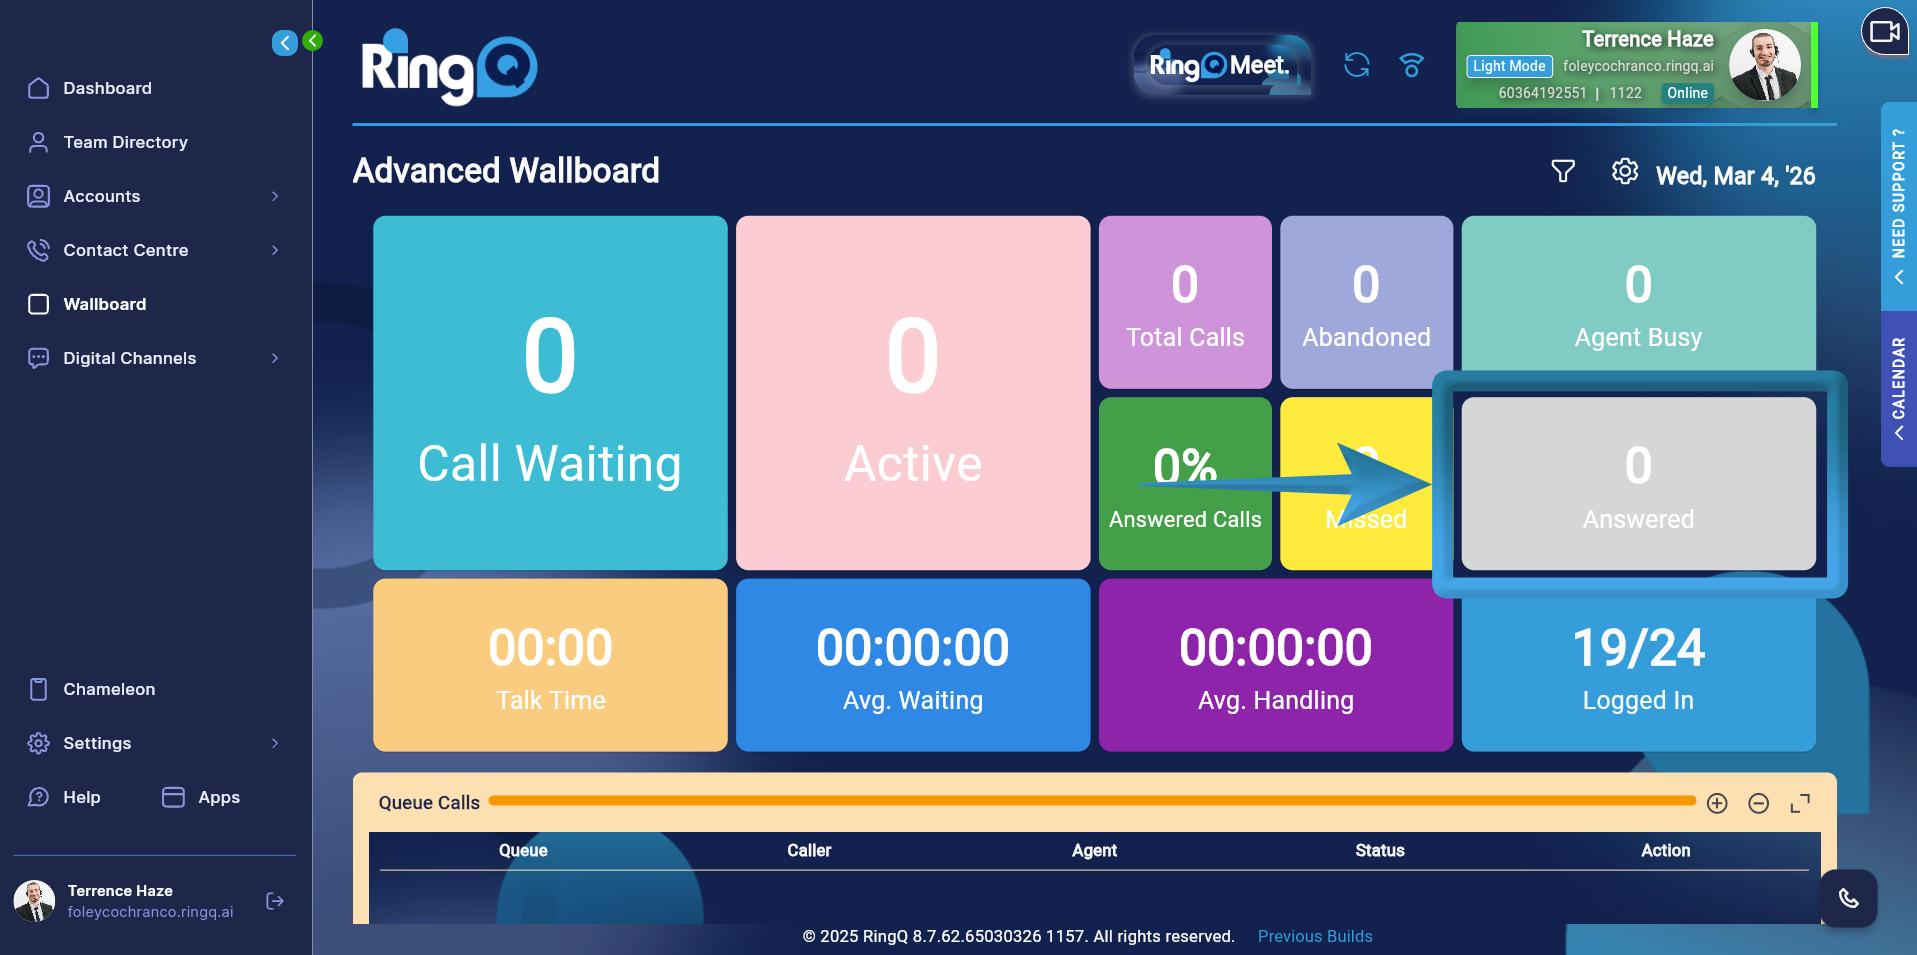 Shows the total number of calls successfully answered by agents.
Formula: ANSWERED = SUM(answered_calls)
This metric counts only the calls that were connected to an agent.
Shows the total number of calls successfully answered by agents.
Formula: ANSWERED = SUM(answered_calls)
This metric counts only the calls that were connected to an agent.
Talk Time
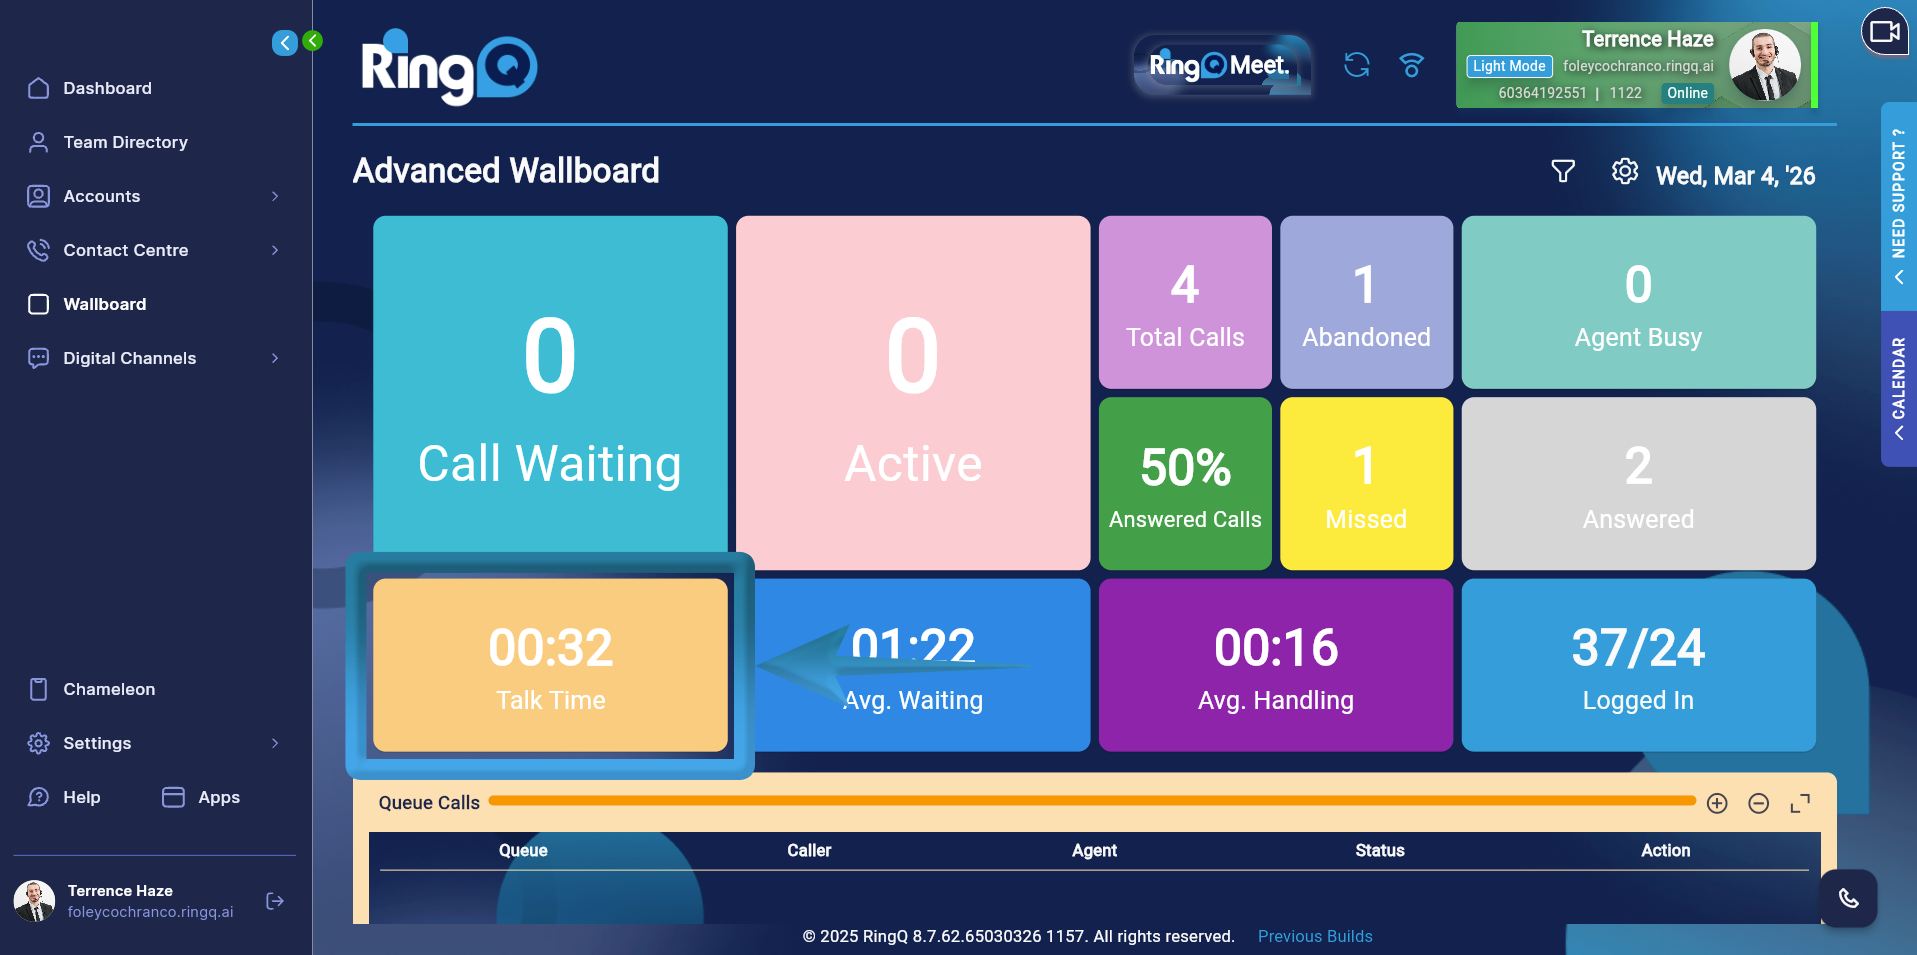 Represents the total time agents spent talking with callers.
Formula: TALK TIME = SUM(talk_time)
The system aggregates the duration of all completed conversations between agents and callers.
Represents the total time agents spent talking with callers.
Formula: TALK TIME = SUM(talk_time)
The system aggregates the duration of all completed conversations between agents and callers.
Average Waiting Time
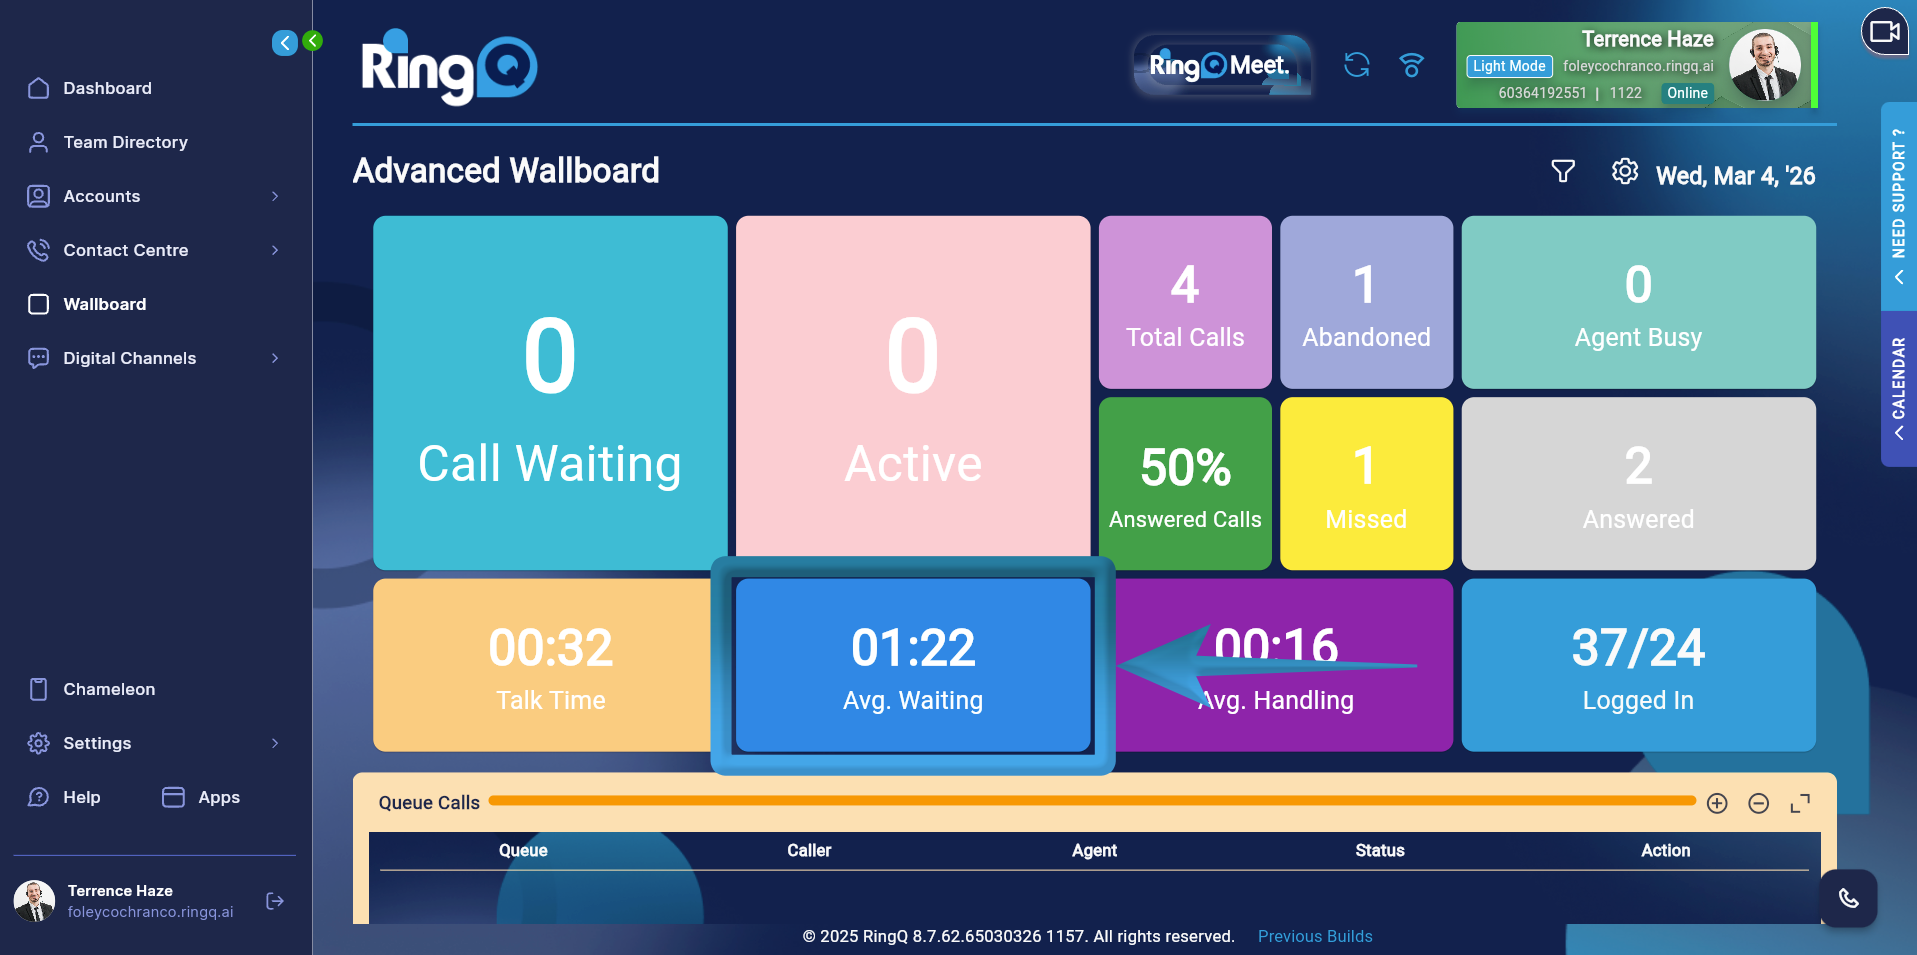 Shows the average time callers waited in the queue before being answered.
Formula: AVG WAITING = SUM(waiting_seconds) /SUM(total_wallboard)
This value is calculated by dividing the total waiting time of all calls by the total number of received calls.
Shows the average time callers waited in the queue before being answered.
Formula: AVG WAITING = SUM(waiting_seconds) /SUM(total_wallboard)
This value is calculated by dividing the total waiting time of all calls by the total number of received calls.
Average Handling Time
 Represents the average time required to handle a call, including both waiting time and talk time.
Formula: AVG HANDLING = (SUM(talk_time) + SUM(waiting_seconds)) / SUM(total_wallboard)
This metric reflects the total time spent on calls from queue entry to call completion.
Represents the average time required to handle a call, including both waiting time and talk time.
Formula: AVG HANDLING = (SUM(talk_time) + SUM(waiting_seconds)) / SUM(total_wallboard)
This metric reflects the total time spent on calls from queue entry to call completion.
Summary Table
| Metric | Formula |
| Call Waiting | SUM(waiting_wallboard) |
| Active Call | SUM(answered_wallboard) |
| Total Calls | SUM(total_wallboard) |
| Abandoned | SUM(abandoned_wallboard) |
| Missed | SUM(missed_calls) |
| Answered | SUM(answered_calls) |
| Talk Time | SUM(talk_time) |
| Avg Waiting | SUM(waiting_seconds) / SUM(total_wallboard) |
| Avg Handling | (SUM(talk_time) + SUM(waiting_seconds)) / SUM(total_wallboard) |